

A Journey Optimizing CKB Smart Contract

Recently I’ve been through a journey optimizing cycle consumption of merkle-mountain-range’s verifier. It’s been a fascinating and surprising trip so far, that I couldn’t wait to share the insights with you.
A Crash Course on MMR
For those who are not so familiar with Merkle Mountain Range (or MMR for short), it’s basically a tree-based structure (Well, in fact, there might be multiple trees involved but that is just a minor detail), allowing one to prove that one or more elements exist in the data structure. An example of an MMR, looks like the following:
           14
         /    \
        /      \
       /        \
      /          \
     6            13            21
   /   \        /    \        /    \
  2     5      9     12     17     20
 / \   / \    / \   /  \   /  \   /  \
0   1 3   4  7   8 10  11 15  16 18  19
Each leaf node contains a user-defined value, whereas each non-leaf node contains a value that is a hash of its children’s values, for example, node 13 will contain the hash of nodes 9 and 12, while node 20 will contain the hash of nodes 18 and 19. Finally, we then hash all the root elements of each tree together, resulting in a value named root hash. In this example, the root hash of the MMR will be the hash of nodes 14 and 21. An MMR root hash, together with the size of elements in the MMR structure (typically named mmr_size), uniquely defines the MMR structure.
To prove the existence of certain nodes, a proof will be generated based on the node indices and MMR structure. A verifier can validate the proof given the following inputs:
Indices and values of nodes whose existences need proving
The generated proof
MMR root hash
mmr_size
Conceptually, the proof will help the verifier calculate an actual root hash, and then compare it against the given MMR root hash, the proof is considered valid when they are identical. For instance, to prove the existence of node 7 and node 11, a proof will contain values of nodes 6, 8, 10, and 21. The verifier then proceeds with the following steps:
Use the values of nodes 7 and 8 to calculate the value of node 9
Use the values of nodes 10 and 11 to calculate the value of node 12
Use the values of nodes 9 and 12 to calculate the value of node 13
Use the values of nodes 6 and 13 to calculate the value of node 14
Finally, use the values of node 14 and node 21 to calculate an actual root hash
When the actual root hash matches the given MMR root hash, the proof is considered valid
For more details on MMR, please consult this introduction, as well as our implementation.
MMR on CKB
We want to use MMR on CKB, meaning we want to keep root hash and mmr_size from an MMR structure in a cell. In a transaction involving that particular cell, we can then prove that certain leaf nodes exist in the MMR. This way a lot of information can be kept in a CKB cell with minimal and most importantly, constant space. The design here also means we will need to run MMR’s verifier in each transaction on-chain that needs access to MMR’s leaf values, the cycle consumption of MMR’s verifier, suddenly becomes a non-trivial issue.
Starting from here, we embark on a journey optimizing cycle consumptions of MMR’s verifier on CKB-VM. This post will cover many topics relating to CKB smart contract optimizations, including:
Using pprof to profile smart contracts for hot paths
Using eBPF to inspect runtime statistics of CKB smart contracts
Differences between C and Rust smart contracts implementing the same algorithm
How we can optimize Rust smart contracts to be as performant as the C ones, but still write idiomatic Rust as much as possible
Environment Setup
All the steps in this post have been tested on an x86_64 machine running Ubuntu 22.04. If you are in other environments, some steps might vary. If you have docker installed, you can fire up a docker container that can act as a virtual machine for experiments:
$ sudo docker run --rm -it --network host docker.io/ubuntu:jammy
$ # or if you are using podman ...
$ podman run --rm -it --network host docker.io/ubuntu:jammy
But do notice that you will not be able the run the BPF part using a docker container!
Some initial steps are required to install the needed dependencies:
$ # if you are on absolutely minimal environment, install sudo first:
$ apt-get update && apt-get install -y sudo
$ # now install all required dependencies used in this post:
$ sudo apt-get install -y lsb-release curl \
        gcc-riscv64-unknown-elf picolibc-riscv64-unknown-elf \
        build-essential git \
        golang-go graphviz \
        bpfcc-tools linux-headers-$(uname -r) python3-pyelftools; \
    go install github.com/google/pprof@latest; \
  curl https://sh.rustup.rs -sSf | sh -s -- -y; \
  source "$HOME/.cargo/env"; \
    curl -f <https://raw.githubusercontent.com/xxuejie/ckb-contract-toolchains/main/install.sh> | bash -s -- 20230331-2; \
  git clone <https://github.com/xxuejie/ckb-standalone-debugger> \
      /tmp/ckb-standalone-debugger; \
    cd /tmp/ckb-standalone-debugger; \
    git checkout 87ced1f1bc3171c998dec11f02b500bb77fa8813; \
    cargo build --release; \
    sudo mv target/release/ckb-debugger \
      target/release/ckb-vm-pprof-converter /usr/local/bin/; \
    cd -; \
    rm -rf /tmp/ckb-standalone-debugger
Now locate a folder where you are comfortable cloning code. We will be cloning two required repositories there. Here I’m using ~/code but feel free to pick other locations:
$ mkdir -p ~/code; \\
  cd ~/code; \\
  export TOP=`pwd`; \\
  git clone --recursive <https://github.com/xxuejie/mmr-post-demo>; \\
  git clone <https://github.com/xxuejie/ckb-vm-bpf-toolkit>
mmr-post-demo contains all the code related to this post. We have organized the code at each step in individual commit/branch for easier reference. ckb-vm-bpf-toolkit provides a toolkit for us to inspect CKB smart contracts, we shall see later how this is used in the code.
Step 0 Baseline Rust verifier
To checkout the code at Step 0 and build it, use the following command:
$ cd $TOP/mmr-post-demo; git checkout step-0; ./build.sh
You can see the code changed at Step 0 here. As the initial step of a performance optimization job, we start out building the skeleton part containing two Rust crates:
tx-generatorgenerates a random MMR structure, samples some leaf nodes to prove, and assembles all the data into a JSON file for CKB-debugger to use.rust-baseline-verifierprovides a baseline Rust-based verifier, giving us insights into the current cycle consumption of MMR’s verifier without any optimizations done by us.
When the code is built successfully, the following command can be used to generate MMR structure and run the verifier:
root@homerig:~/code/mmr-post-demo# ./target/release/tx-generator tx.json target/riscv64imac-unknown-none-elf/release/rust-baseline-verifier
Seed: 1680833935496346056
Total leafs: 2192, tested leafs: 58
MMR size: 4381
Proof bytes: 8848, leaf bytes: 2436 leaves: 58
root@homerig:~/code/mmr-post-demo# ckb-debugger --tx-file tx.json --cell-type input --script-group-type lock --cell-index 0
Run result: 0
Total cycles consumed: 2581897(2.5M)
Transfer cycles: 11777(11.5K), running cycles: 2570120(2.5M)
root@homerig:~/code/mmr-post-demo# ./target/release/tx-generator tx.json target/riscv64imac-unknown-none-elf/release/rust-baseline-verifier
Seed: 1680833947559458126
Total leafs: 2520, tested leafs: 76
MMR size: 5034
Proof bytes: 10990, leaf bytes: 3192 leaves: 76
root@homerig:~/code/mmr-post-demo# ckb-debugger --tx-file tx.json --cell-type input --script-group-type lock --cell-index 0
Run result: 0
Total cycles consumed: 3232533(3.1M)
Transfer cycles: 11777(11.5K), running cycles: 3220756(3.1M)
root@homerig:~/code/mmr-post-demo# ./target/release/tx-generator tx.json target/riscv64imac-unknown-none-elf/release/rust-baseline-verifier
Seed: 1680833950103277792
Total leafs: 2461, tested leafs: 54
MMR size: 4915
Proof bytes: 8610, leaf bytes: 2268 leaves: 54
root@homerig:~/code/mmr-post-demo# ckb-debugger --tx-file tx.json --cell-type input --script-group-type lock --cell-index 0
Run result: 0
Total cycles consumed: 2492799(2.4M)
Transfer cycles: 11777(11.5K), running cycles: 2481022(2.4M)
Notice that each time we run tx-generator, a new random seed is being used, resulting in different MMR structures with different numbers of sampled leaves. To make sure we get a reliable benchmark, we will settle on seed 1680833947559458126 throughout this post:
root@homerig:~/code/mmr-post-demo# SEED=1680833947559458126 ./target/release/tx-generator tx.json target/riscv64imac-unknown-none-elf/release/rust-baseline-verifier
Seed: 1680833947559458126
Total leafs: 2520, tested leafs: 76
MMR size: 5034
Proof bytes: 10990, leaf bytes: 3192 leaves: 76
root@homerig:~/code/mmr-post-demo# ckb-debugger --tx-file tx.json --cell-type input --script-group-type lock --cell-index 0
Run result: 0
Total cycles consumed: 3232533(3.1M)
Transfer cycles: 11777(11.5K), running cycles: 3220756(3.1M)
This seed gives us an MMR structure containing 2520 leaves, while 76 leaves are sampled to generate the proof. We can see that the baseline verifier takes 3232533 cycles to validate the MMR proof.
Step 1 Fastest Verifier in C
To checkout the code in Step 1 and build it, use the following command:
$ cd $TOP/mmr-post-demo; git checkout step-1; ./build.sh
You can see the code changed in Step 1 here. The main purpose of this post is to optimize smart contracts in Rust: we want to make a Rust smart contract as fast as a C one, but still reside in the idiomatic Rust world. Hence we started with a particular strange plan: we first start building an MMR verifier in C using all the optimization tricks we know, making sure the C one remains the fastest we know of, we then optimize the Rust smart contract, comparing it with the C ones, trying to make it as close to the C one as possible.
Following this plan, we have designed a fast C-based MMR verifier. This new C-based verifier still resides in a PR and is undergoing review phase, but it does not affect us from trying it out in this experiment. Thus in Step 1 here, we introduced this new C-based verifier into our skeleton work. And we can start testing it:
# note that tx-generator can accept at most 3 different verifier binaries
root@homerig:~/code/mmr-post-demo# SEED=1680833947559458126 ./target/release/tx-generator tx.json target/riscv64imac-unknown-none-elf/release/rust-baseline-verifier c_verifier
Seed: 1680833947559458126
Total leafs: 2520, tested leafs: 76
MMR size: 5034
Proof bytes: 10990, leaf bytes: 3192 leaves: 76
# as shown above, the verifier at input index 0 is the Rust baseline verifier
root@homerig:~/code/mmr-post-demo# ckb-debugger --tx-file tx.json --cell-type input --script-group-type lock --cell-index 0
Run result: 0
Total cycles consumed: 3232533(3.1M)
Transfer cycles: 11777(11.5K), running cycles: 3220756(3.1M)
# the verifier at input index 1 is the new C based verifier
root@homerig:~/code/mmr-post-demo# ckb-debugger --tx-file tx.json --cell-type input --script-group-type lock --cell-index 1
Run result: 0
Total cycles consumed: 3749393(3.6M)
Transfer cycles: 4282(4.2K), running cycles: 3745111(3.6M)
Surprisingly, the new C-based verifier is even slower than the Rust baseline one at this point, but rest assured, we shall soon see that a huge potential in the C-based verifier is still left untouched.
Step 2 Switch to Custom Toolchain
To checkout the code in Step 2 and build it, use the following command (This time, we will clean the old build first):
$ cd $TOP/mmr-post-demo; git checkout step-2; cargo clean; ./build.sh
You can see the code changed in Step 2 here. This time, we will run and show the number first:
root@homerig:~/code/mmr-post-demo# SEED=1680833947559458126 ./target/release/tx-generator tx.json target/riscv64imac_zba_zbb_zbc_zbs-unknown-ckb-elf/release/rust-baseline-ve
rifier c_verifier
Seed: 1680833947559458126
Total leafs: 2520, tested leafs: 76
MMR size: 5034
Proof bytes: 10990, leaf bytes: 3192 leaves: 76
root@homerig:~/code/mmr-post-demo# ckb-debugger --tx-file tx.json --cell-type input --script-group-type lock --cell-index 0
Run result: 0
Total cycles consumed: 2827123(2.7M)
Transfer cycles: 10748(10.5K), running cycles: 2816375(2.7M)
root@homerig:~/code/mmr-post-demo# ckb-debugger --tx-file tx.json --cell-type input --script-group-type lock --cell-index 1
Run result: 0
Total cycles consumed: 1710518(1.6M)
Transfer cycles: 2501(2.4K), running cycles: 1708017(1.6M)
For the careful ones, you might notice that the Rust build now uses riscv64imac_zba_zbb_zbc_zbs-unknown-ckb-elf, instead of the old riscv64imac-unknown-none-elf target. At this step, we have switched to a custom Rust (as well as GNU) toolchain optimized for CKB-VM. Throughout our experience working on CKB smart contracts, we have noticed certain quirks and slowdowns that could be resolved in CKB, but might still take time to (some might never) land on official Rust or GNU toolchains. To better aid at CKB contract development, we have started to maintain a custom toolchain unlocking those new potentials, notable ones include performance optimizations, as well as native std support for Rust smart contracts. It is also worth mentioning that CKB will not deviate from the official RISC-V specification. The custom toolchain will only provide add-ons, not breaking changes. One can always stick to the official Rust or GNU toolchains to work on CKB smart contracts. For more details, please refer to the toolchain repository.
For the baseline Rust smart contract, switching to the new custom toolchain provides somewhat 400000 cycle reductions (Depending on the actual seed you use, this number might vary). However, an even bigger change happens in the C smart contract: the cycle consumptions reduce from 3749393 to 1710518, by using the custom toolchain, we are taking less than half of the cycles to verify MMR proof than before! There might actually be two reasons contributing to this improvement:
Previously, we were using GCC provided by Ubuntu 22.04 to build CKB smart contracts, which is still stuck on GCC
10.2.0, but the custom toolchain has already upgraded to GCC12.2.0. 2 major versions in GCC might bring in a lot of optimizations that result in less cycle consumption.A bigger change, in my personal opinion, comes from RISC-V B extension, B extension provides additional RISC-V instructions that are super handy for low-level computation tasks, such as count leading/trailing zeros, bit-wise rotation, etc. While the official toolchain has to assume chips without B extensions enabled, the custom toolchain by us can enable B extensions freely. With those additional instructions, GCC can perform a whole lot of optimizations that can use one instruction to perform what is previously done via dozens or even hundreds of instructions. This can provide from a somewhat noticeable to a rather huge performance boost, depending on the actual application.
Simply put, the new C-based verifier, together with the new custom toolchain, provides the best performance for verifying MMR proofs. Now the question is: can we build a Rust MMR verifier contract with the same performance as the C one, but still using idiomatic Rust as much as possible?
Side Track: How to Profile CKB Smart Contracts?
Personally, I believe there are two ways for optimizing performance in general:
Use a profiler to profile your program, find the most time-consuming part, either replace this part with a faster implementation, or find a way to remove this part. Then continue to find the next hot path, and repeat the whole process until you are running out of a noticeable hot path. This solution can typically help you reduce 5% - 30% of the overall running time, depending on your application. And if you are really lucky, you might notice something that can help you eliminate 50% or more of the running time, giving you a once-in-a-while optimization success. However, notice that this path might frequently result in less maintainable code, it’s always a tradeoff between beautiful code and rewriting hot paths.
If more performance boost is really necessary, say you need 5x or 10x of the current performance, the only viable path IMHO, would be a major rewrite, either from the algorithm point of view, or from an architecture point of view. You really need to overhaul certain design choices that go into the older architecture, building a new one with a different mindset, aiming at a much higher discipline than you previously enforced. As the legendary Jeff Dean once mentioned, "Design for ~10X growth, but plan to rewrite before ~100X”.
Here our goal is to reduce cycle consumption of the Rust contract from 2827123 to ~1710518, or roughly a 40% cycle reduction. At this scale, we can start with the first option: let’s try profiling the Rust MMR verifier, and see where are the hot paths we can work on.
CKB-debugger already has supported profiling smart contracts leveraging the amazing pprof tool from Google. If you have followed the previous Environment Setup section, you will already have the required tools installed. But just in case, you can test the individual commands again:
$ ckb-vm-pprof-converter --version
ckb-vm-pprof-converter 0.1.0
$ ~/go/bin/pprof
(... detailed pprof usage)
pprof: no profile source specified
Make sure you have built the code following the instructions in the previous steps, we can start profiling the contracts:
root@homerig:~/code/mmr-post-demo# SEED=1680833947559458126 ./target/release/tx-generator tx.json target/riscv64imac_zba_zbb_zbc_zbs-unknown-ckb-elf/release/rust-baseline-verifier c_verifier
Seed: 1680833947559458126
Total leafs: 2520, tested leafs: 76
MMR size: 5034
Proof bytes: 10990, leaf bytes: 3192 leaves: 76
root@homerig:~/code/mmr-post-demo# ckb-debugger --tx-file tx.json --cell-type input --script-group-type lock --cell-index 0 --pprof baseline.data
Run result: 0
Total cycles consumed: 2827123(2.7M)
Transfer cycles: 10748(10.5K), running cycles: 2816375(2.7M)
root@homerig:~/code/mmr-post-demo# ckb-debugger --tx-file tx.json --cell-type input --script-group-type lock --cell-index 1 --pprof c.data
Run result: 0
Total cycles consumed: 1710518(1.6M)
Transfer cycles: 2501(2.4K), running cycles: 1708017(1.6M)
root@homerig:~/code/mmr-post-demo# ckb-vm-pprof-converter --input-file baseline.data --output-file baseline.pprof
root@homerig:~/code/mmr-post-demo# ckb-vm-pprof-converter --input-file c.data --output-file c.pprof
Now you have the profiled data ready to use, you can either start a web server where you can inspect the Rust baseline contract:
root@homerig:~/code/mmr-post-demo# ~/go/bin/pprof -http 0.0.0.0:8001 -sample_index cycles target/riscv64imac_zba_zbb_zbc_zbs-unknown-ckb-elf/release/rust-baseline-verifier baseline.pprof
Serving web UI on <http://0.0.0.0:8001>
Note that if you are running the commands locally, your browser might automatically open the page, otherwise, you might need to manually navigate to http://<your ip address>8001
Or you can also start the web server to inspect the C contract:
root@homerig:~/code/mmr-post-demo# ~/go/bin/pprof -http 0.0.0.0:8001 -sample_index cycles c_verifier c.pprof
Serving web UI on <http://0.0.0.0:8001>
If you are not familiar with pprof, I do recommend spending some time on the web page, make sure you know where to find the following contents:
A call graph showcasing cycle consumptions of each function. If you are not familiar with the meaning of different arrows or boxes of different colors, click on the link at the top-right of the page saying either
rust-baseline-verifier cyclesorc_verifier cycles, you can then find a link in the tooltip explaining how to read the graph.A
toppage showing a list of functions with their consumed cycles (and percentage)A flamegraph showing function runtime statistics
The call graph will be the focus of this post, but the other 2 pages can also be helpful at times. You can also generate the call graph directly as SVG files:
root@homerig:~/code/mmr-post-demo# ~/go/bin/pprof -svg -output baseline.svg -sample_index cycles target/riscv64imac_zba_zbb_zbc_zbs-unknown-ckb-elf/release/rust-baseline-verifier baseline.pprof
Generating report in baseline.svg
root@homerig:~/code/mmr-post-demo# ~/go/bin/pprof -svg -output c.svg -sample_index cycles c_verifier c.pprof
Generating report in c.svg
As an example, here’s the SVG call graph generated for the baseline contract:
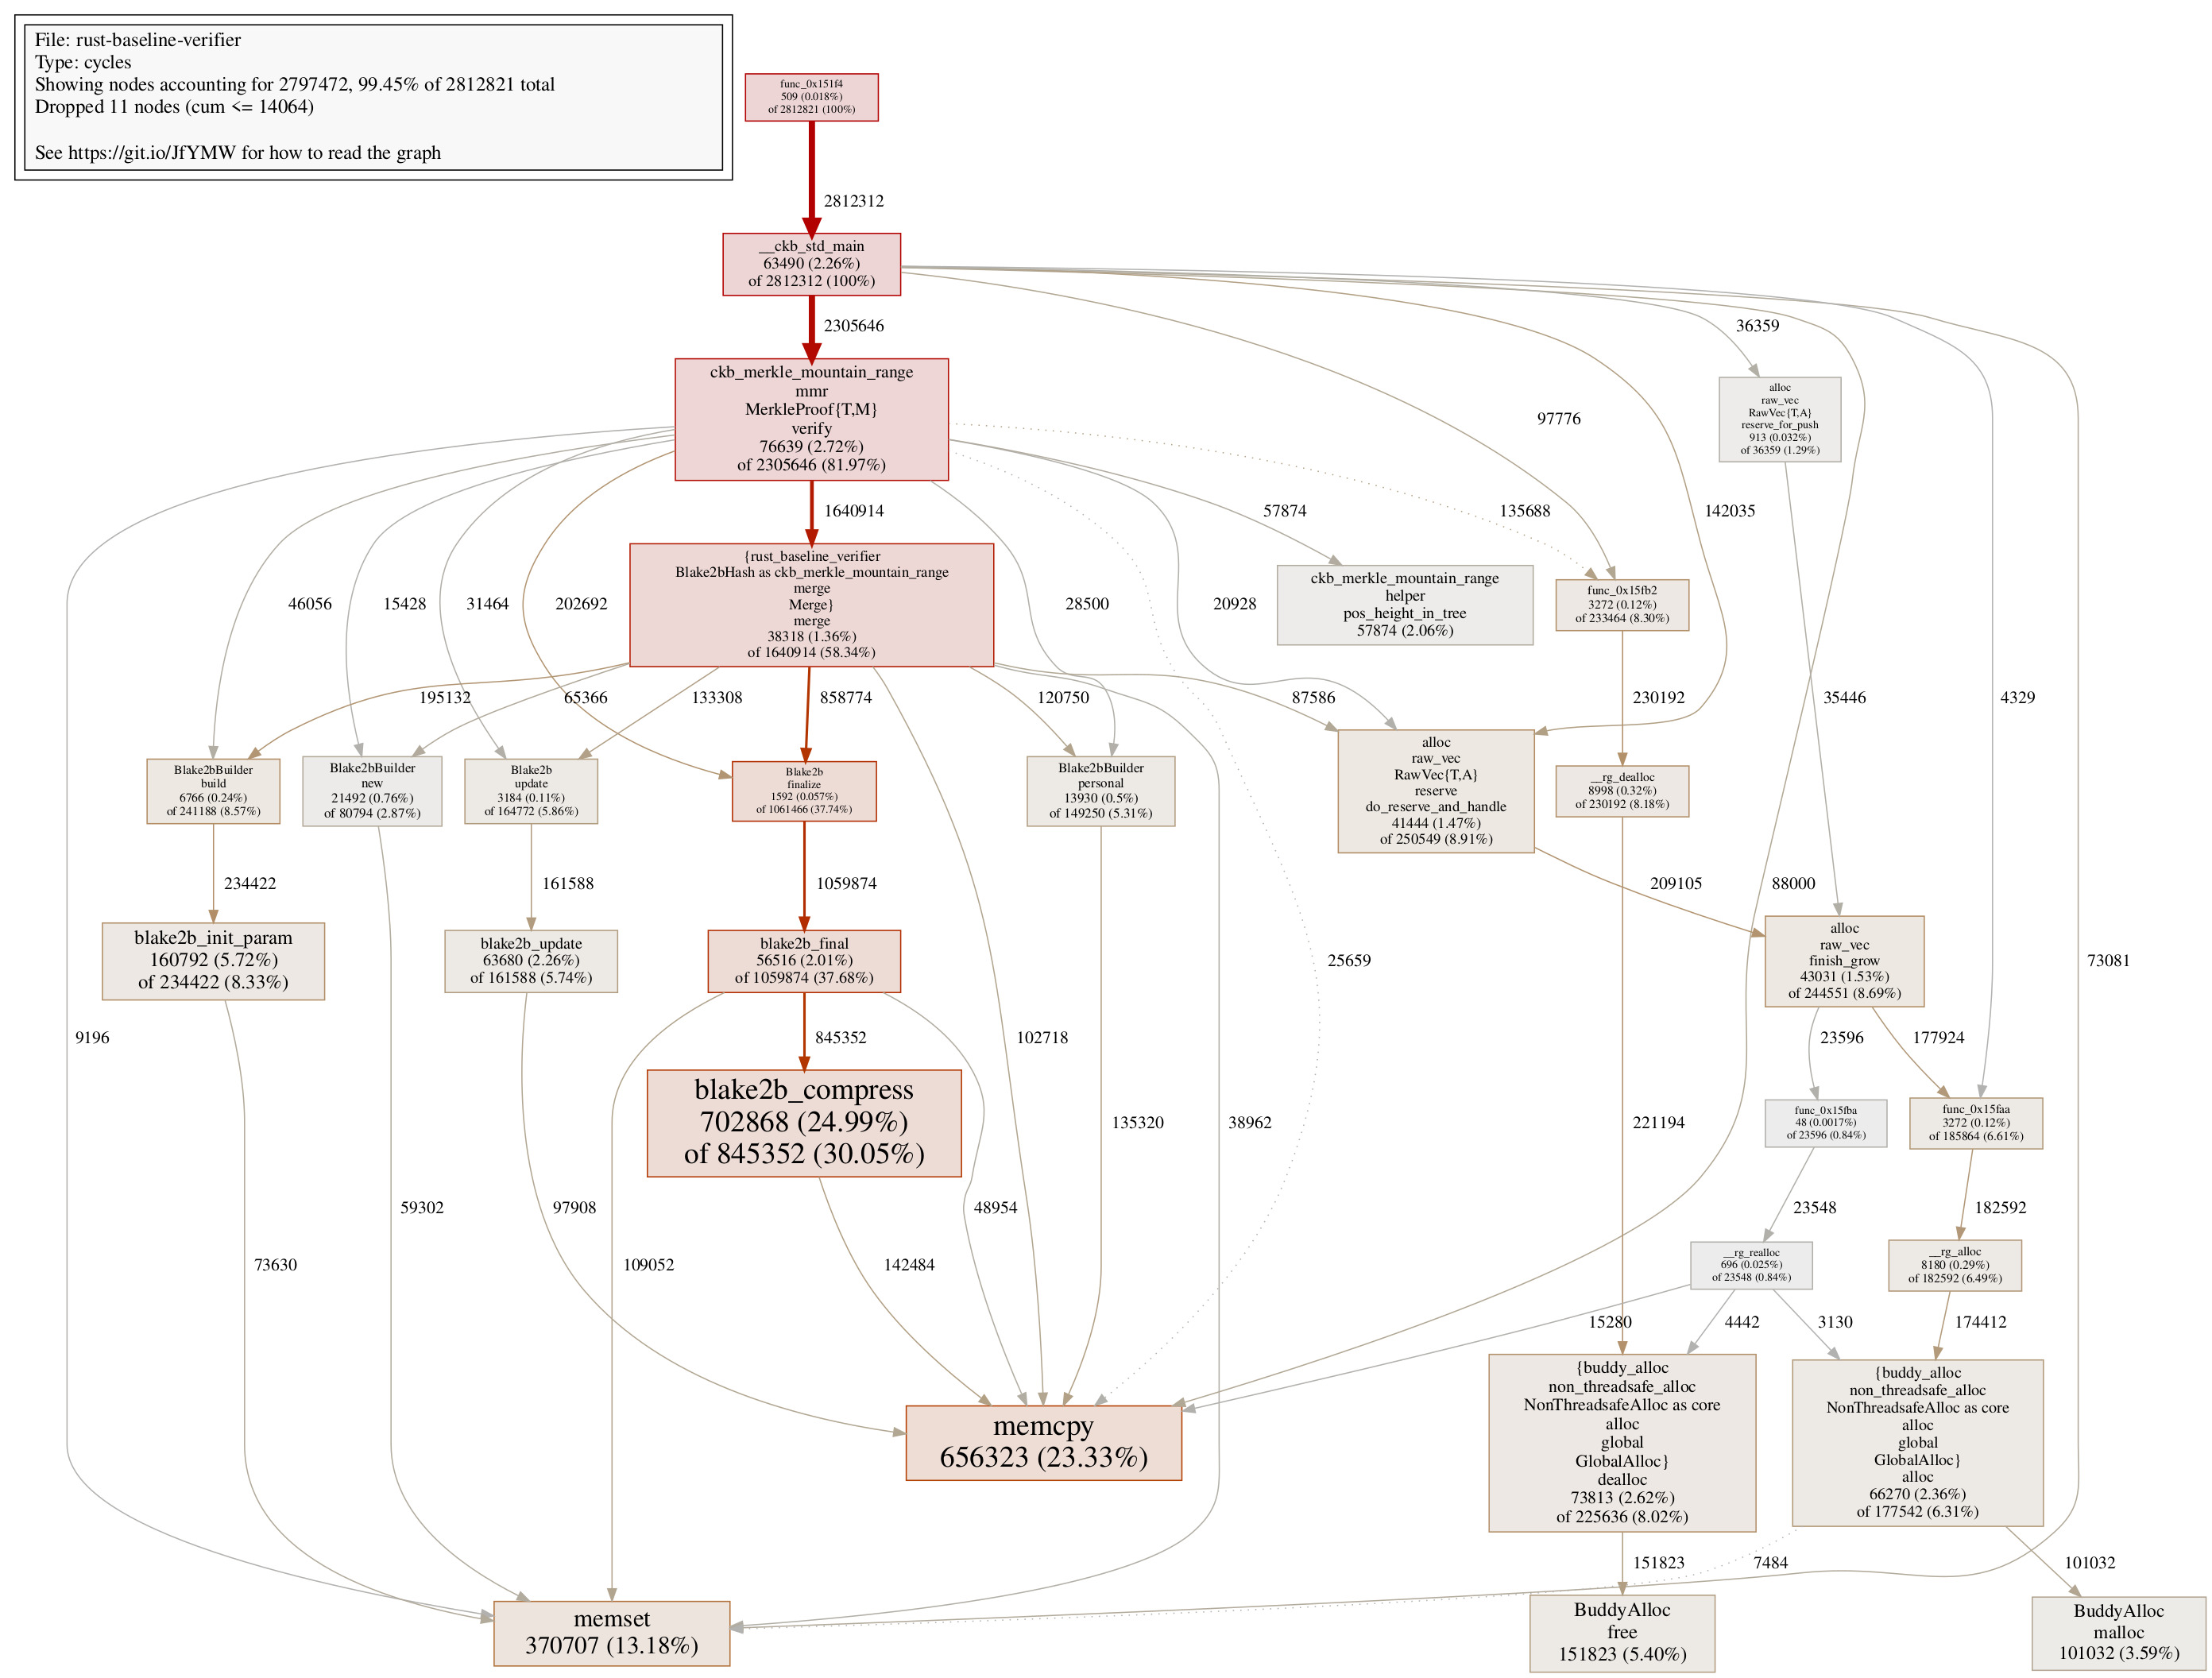
Open the image above in a new tab for a better view! (This applies to all images in this post.)
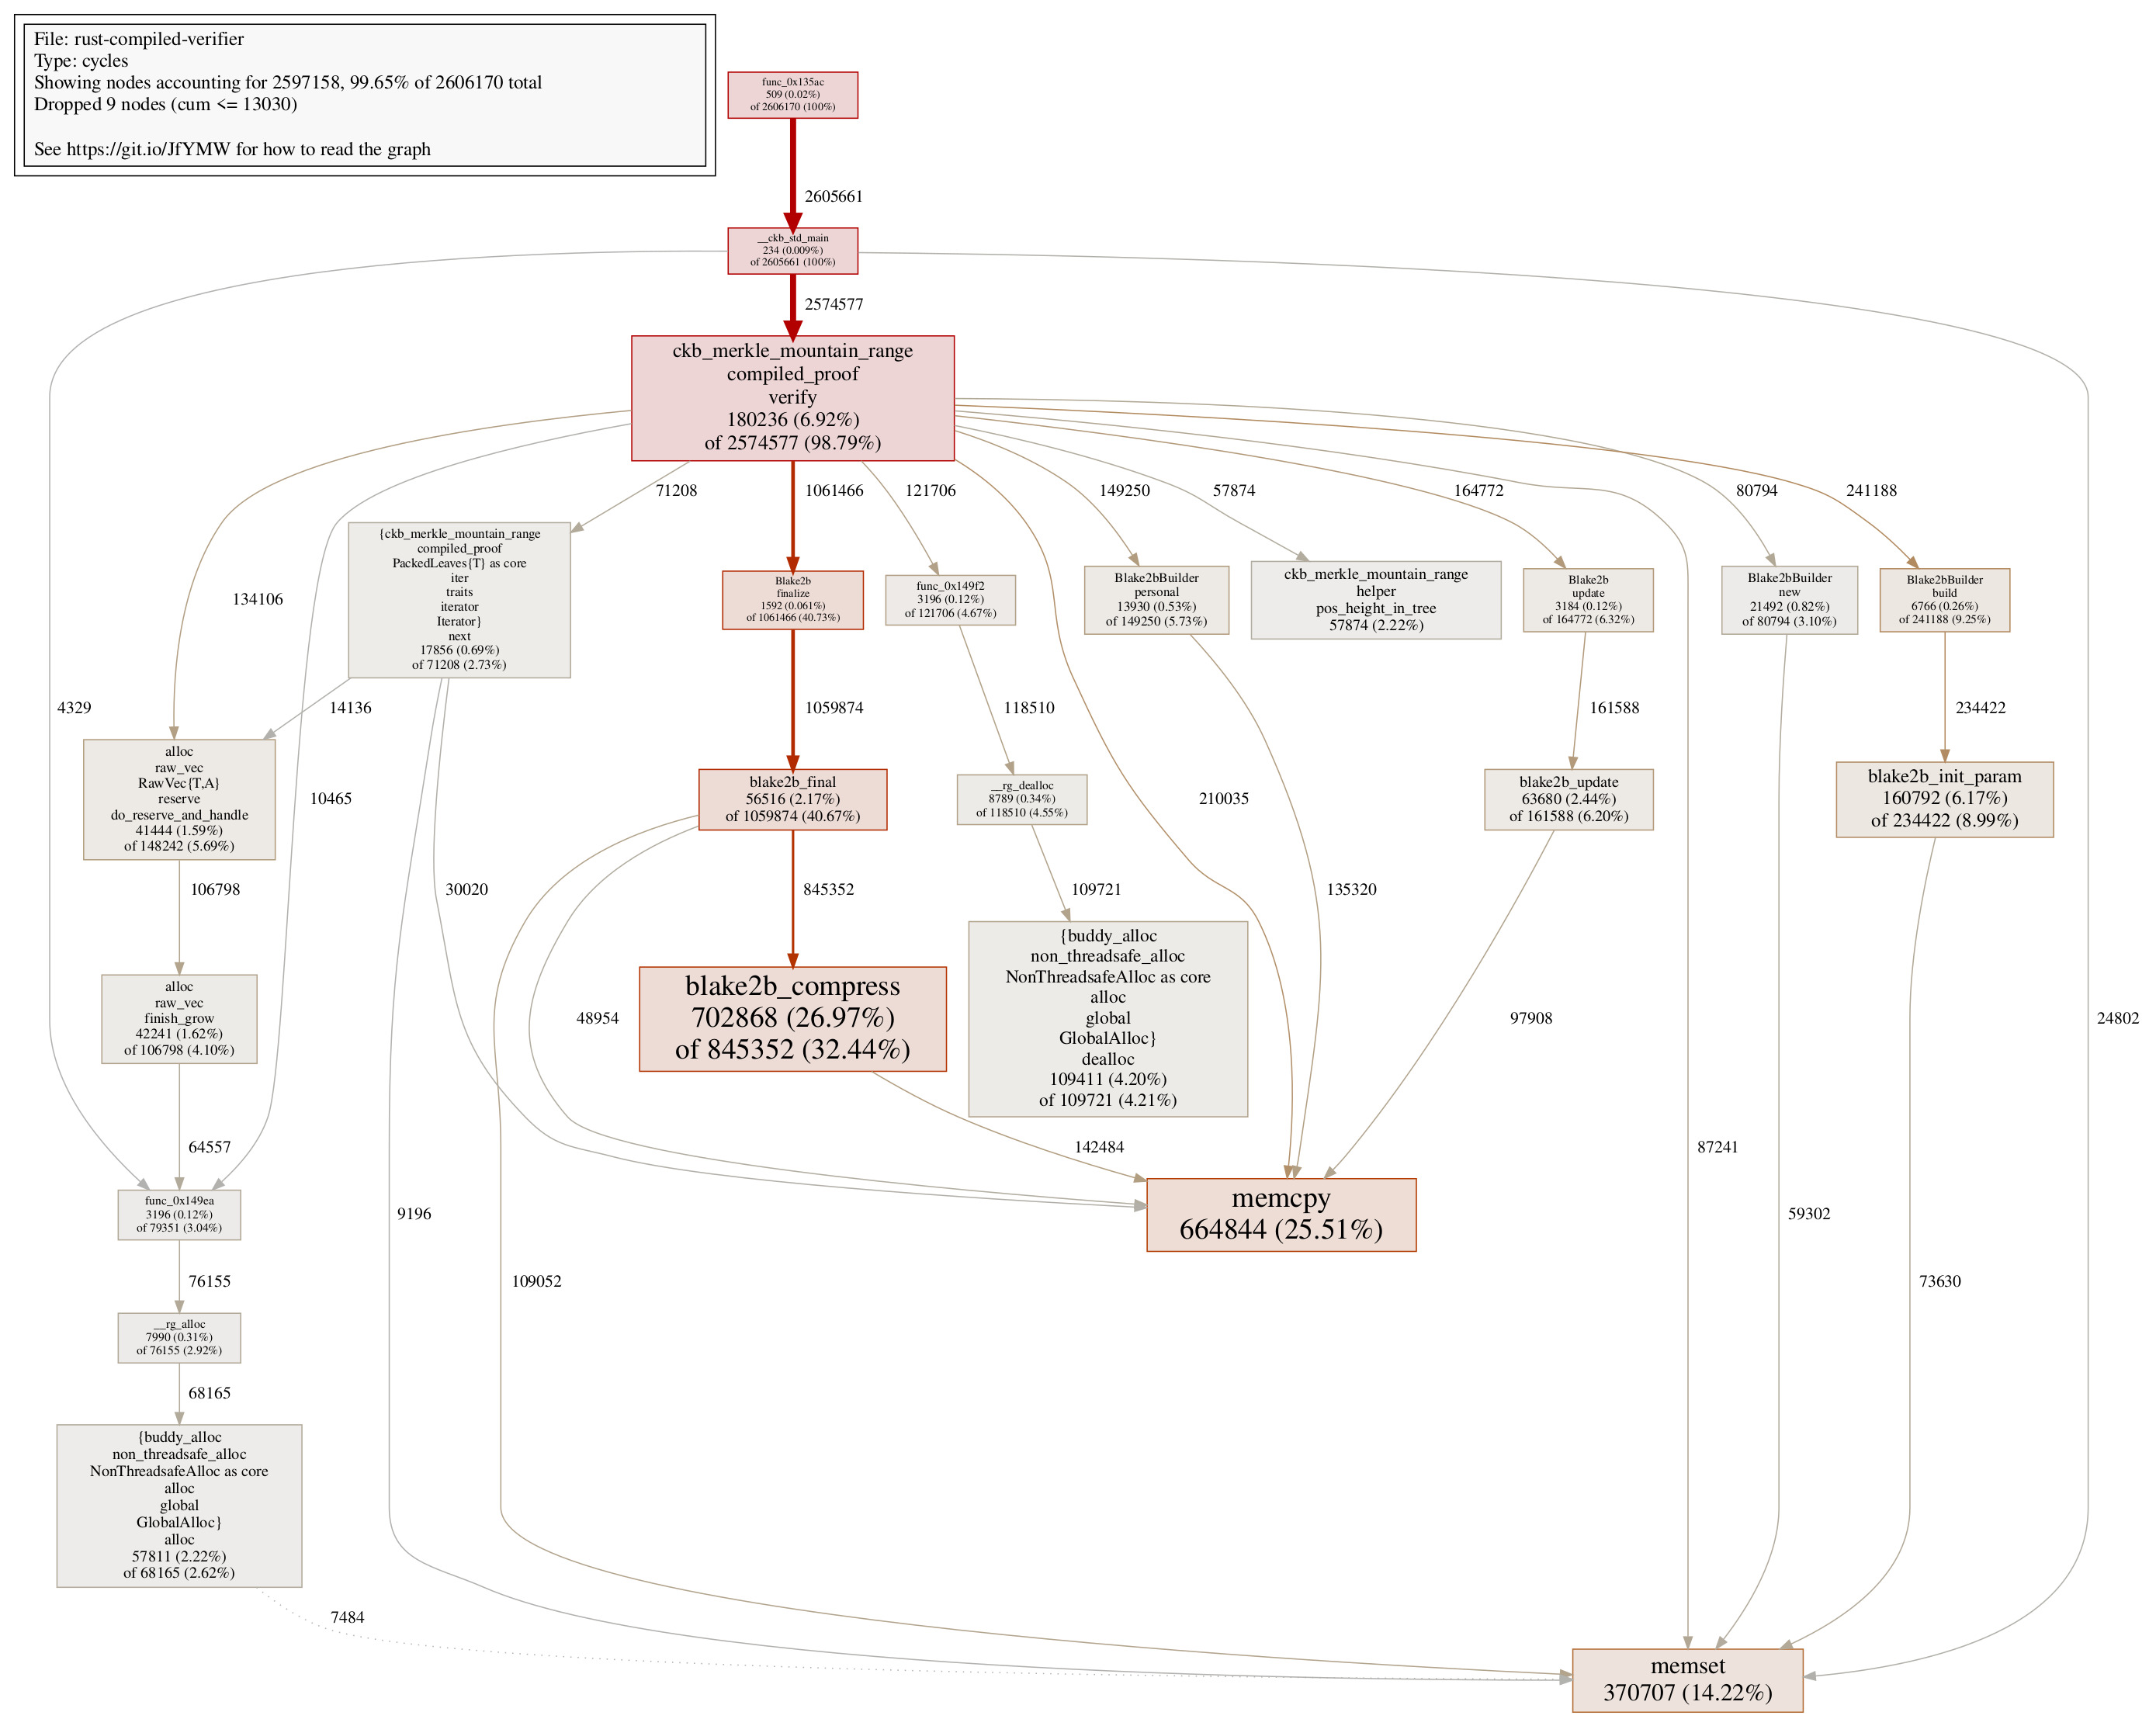
And for reference reasons, here’s the call graph for the fastest C contract:

One might notice that the call graph for the C contract is much tidier than the Rust counterpart.
Step 3 Add Interpreter-Based Rust Verifier
If you have looked at the MMR C verifier code carefully, you might notice that instead of a vector of proof items, the C verifier leverages a serialized buffer of proof data, then reads out commands from the proof data much like a small interpreter. This is due to the observation that MMR proof verification is nothing but a series of hash functions applied to designated values in a certain order. The fundamental security of the MMR proof comes mostly from the cryptographic hash functions, so by rearranging values used in hash functions and property checks, we can build a small interpreter that verifies MMR proof using nothing but a linear stack.
This brings an idea here: what if we apply the same technique in the Rust code? Will a linear stack save us cycles used to maintain vectors and dynamic insertions/deletions on stack? This brings out Step 3 of optimizations.
To checkout the code in Step 3 and build it, use the following command:
$ cd $TOP/mmr-post-demo; git checkout step-3; ./build.sh
You can see the code changed in Step 3 here. Here are the performance numbers:
root@homerig:~/code/mmr-post-demo# SEED=1680833947559458126 ./target/release/tx-generator tx.json target/riscv64imac_zba_zbb_zbc_zbs-unknown-ckb-elf/release/rust-baseline-verifier c_verifier target/riscv64imac_zba_zbb_zbc_zbs-unknown-ckb-elf/release/rust-compiled-verifier
Seed: 1680833947559458126
Total leafs: 2520, tested leafs: 76
MMR size: 5034
Proof bytes: 10990, leaf bytes: 3192 leaves: 76
root@homerig:~/code/mmr-post-demo# ckb-debugger --tx-file tx.json --cell-type input --script-group-type lock --cell-index 0 --pprof baseline.data
Run result: 0
Total cycles consumed: 2827123(2.7M)
Transfer cycles: 10748(10.5K), running cycles: 2816375(2.7M)
root@homerig:~/code/mmr-post-demo# ckb-debugger --tx-file tx.json --cell-type input --script-group-type lock --cell-index 1 --pprof c.data
Run result: 0
Total cycles consumed: 1710518(1.6M)
Transfer cycles: 2501(2.4K), running cycles: 1708017(1.6M)
root@homerig:~/code/mmr-post-demo# ckb-debugger --tx-file tx.json --cell-type input --script-group-type lock --cell-index 2 --pprof compiled.data
Run result: 0
Total cycles consumed: 2619154(2.5M)
Transfer cycles: 9230(9.0K), running cycles: 2609924(2.5M)
Note that the baseline verifier is left untouched for comparison purposes, we have added a new rust-compiled-verifier crate using the interpreter-based design, the compiled part in the crate names comes from the fact that the serialized proof is named CompiledMerkleProof compared to the original MerkleProof. As shown in the numbers, the compiled verifier consumes roughly 200000 fewer cycles than the baseline verifier, which is an improvement but not by a large margin, and certainly still far from our goal. We will need to dig deeper here.
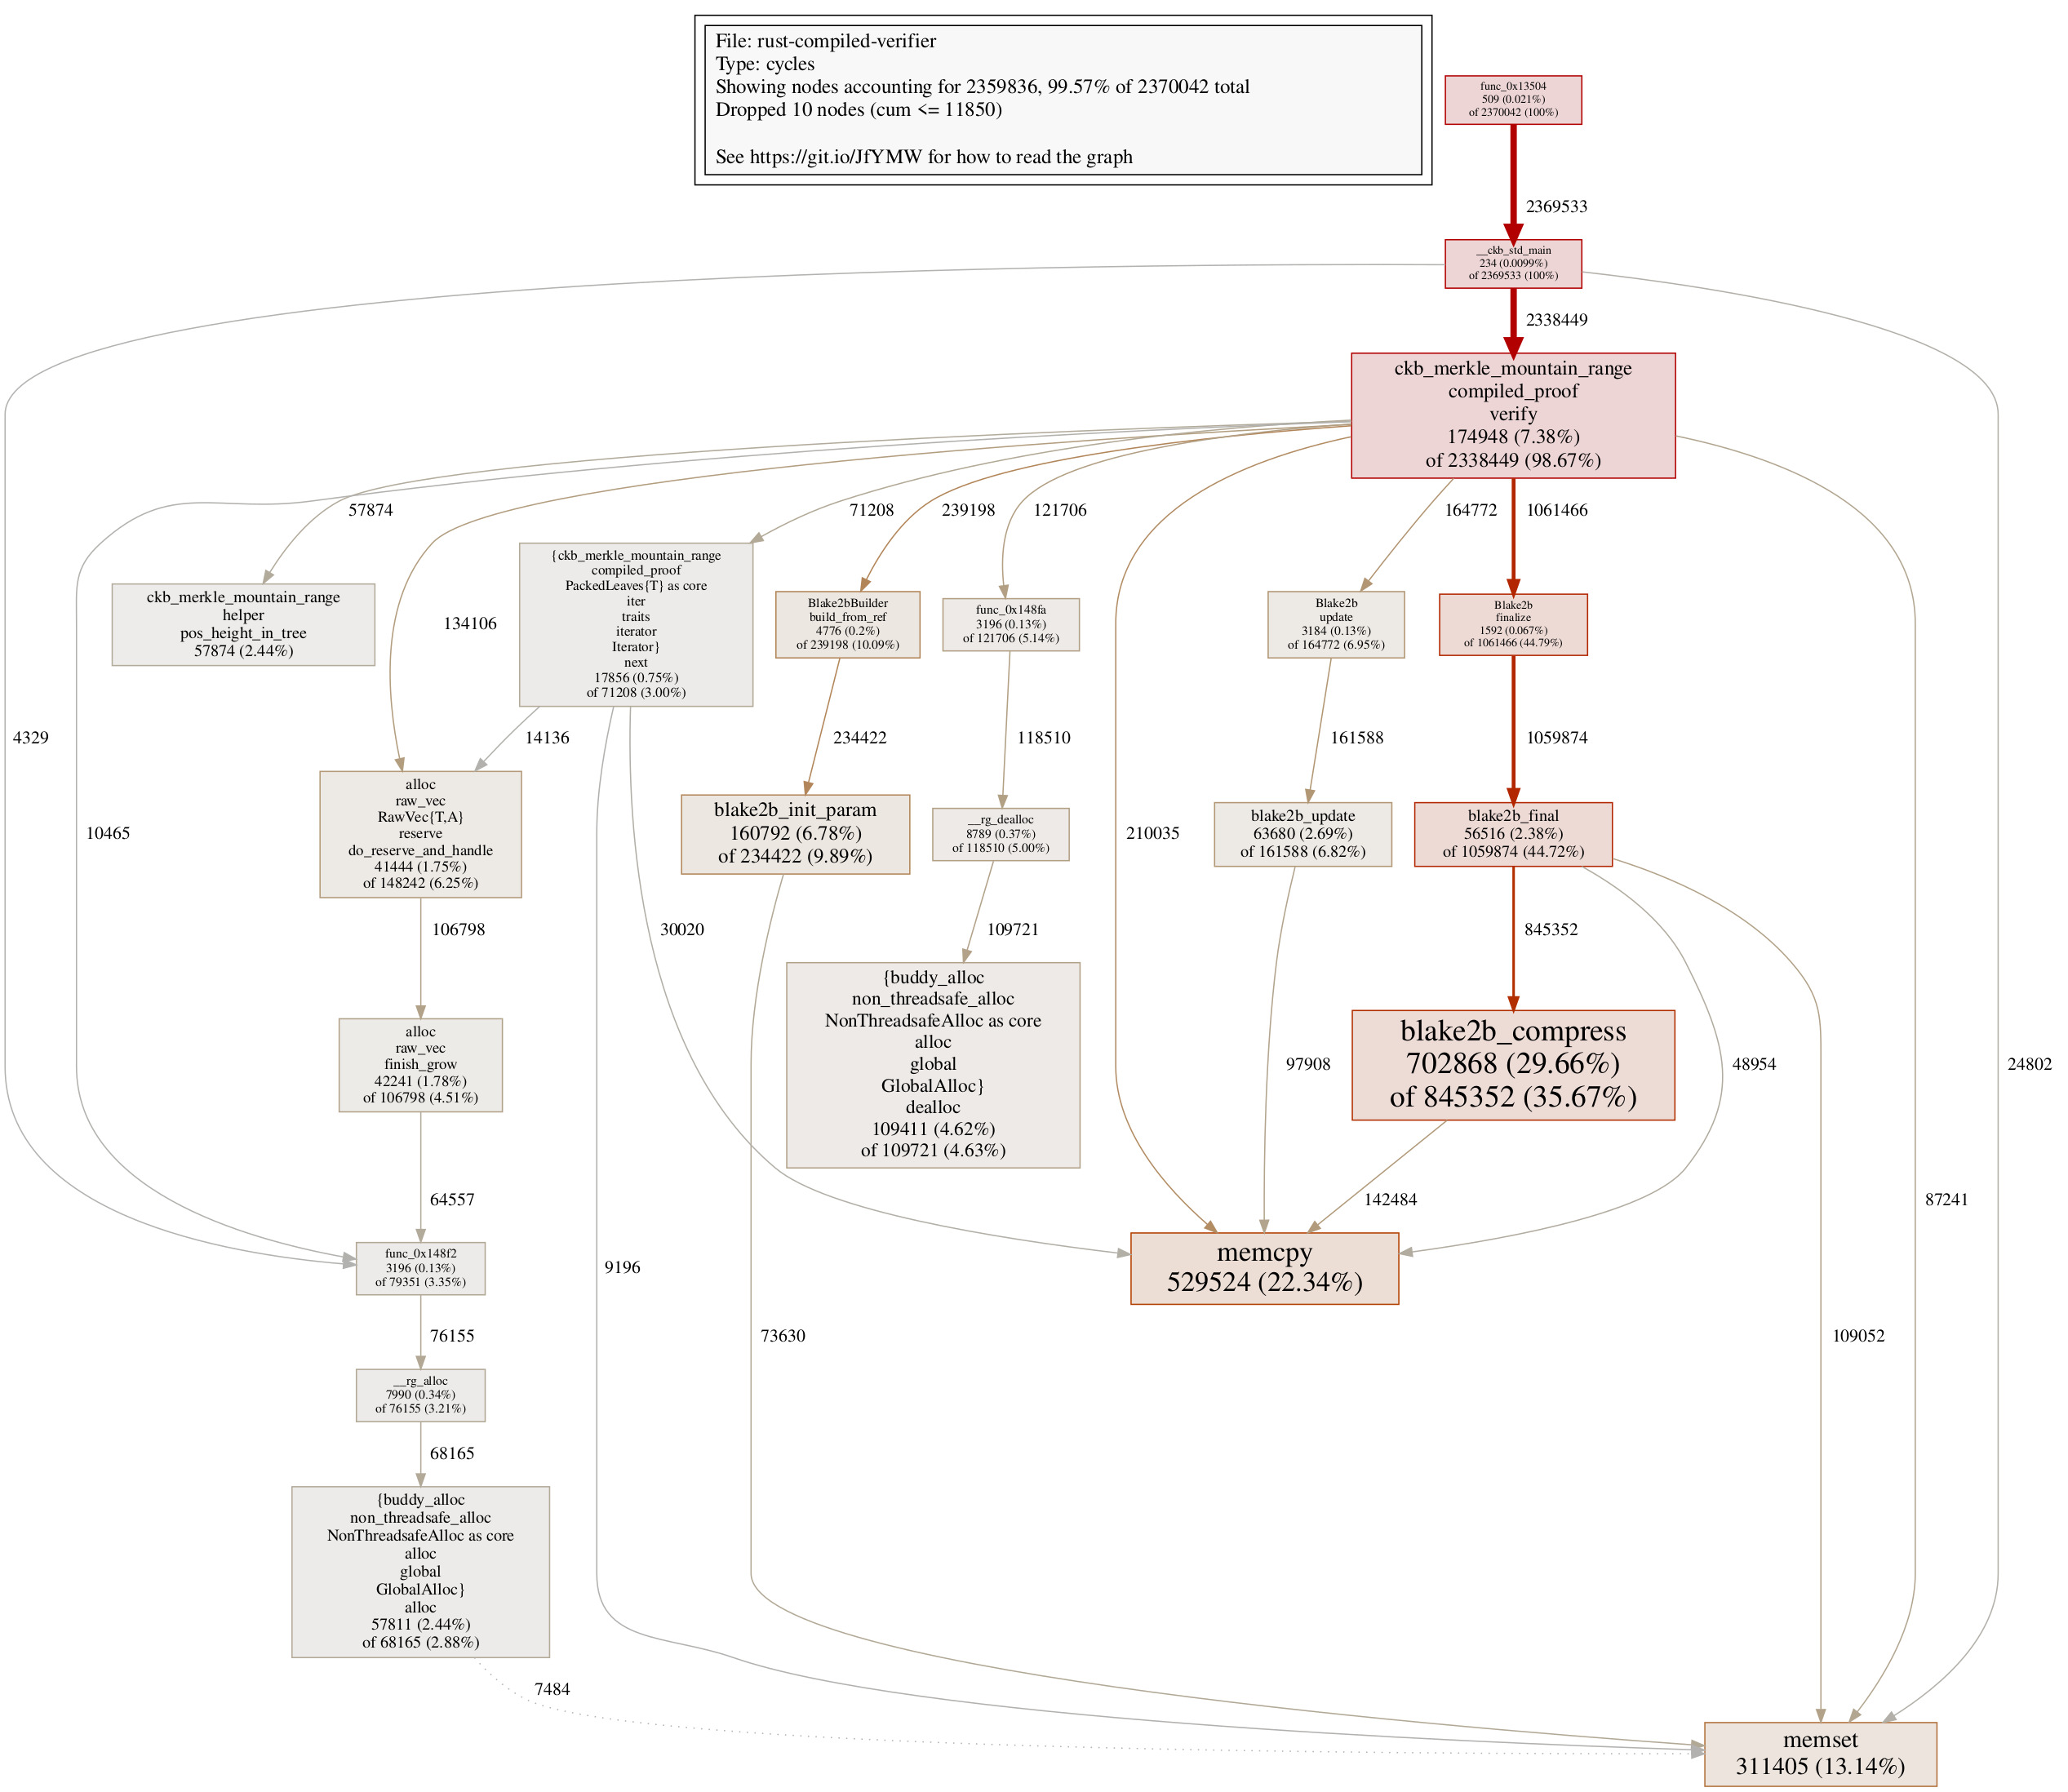
For reference reason and usage in the next step, here’s the pprof call graph for the compiled verifier in Step 3:
Step 4 Constant Hash Builder
One thing we can notice in the pprof call graph, is that blake2b initialization takes a lot of cycles:
Blake2bBuilder::buildconsumes 241188 cyclesBlake2bBuilder::newconsumes 80794 cyclesBlake2bBuilder::personalconsumes 149250 cycles
Somewhat ~470000 cycles are wasted initialization blake2b hasher, while in fact we are only using one type of blake2b hasher in the verifier. So the idea is: what if we can make the blake2b hasher constant, so all we need to do is initialize it once, not again and again? This brings the change in Step 4.
To checkout the code in Step 4 and build it, use the following command:
$ cd $TOP/mmr-post-demo; git checkout step-4; ./build.sh
You can see the code changed in Step 4 here. Notice Step 4 is only possible with changes at blake2b-rs crate side. In addition to making the hash builder constant, there are actually more changes in blake2b-rs, which will be leveraged in later steps of our optimization.
After this change, another ~230000 cycles can be reduced in the compiled MMR verifier:
root@homerig:~/code/mmr-post-demo# SEED=1680833947559458126 ./target/release/tx-generator tx.json target/riscv64imac_zba_zbb_zbc_zbs-unknown-ckb-elf/release/rust-baseline-verifier c_verifier target/riscv64imac_zba_zbb_zbc_zbs-unknown-ckb-elf/release/rust-compiled-verifier
Seed: 1680833947559458126
Total leafs: 2520, tested leafs: 76
MMR size: 5034
Proof bytes: 10990, leaf bytes: 3192 leaves: 76
root@homerig:~/code/mmr-post-demo# ckb-debugger --tx-file tx.json --cell-type input --script-group-type lock --cell-index 2 --pprof compiled.data
Run result: 0
Total cycles consumed: 2382911(2.3M)
Transfer cycles: 9115(8.9K), running cycles: 2373796(2.3M)
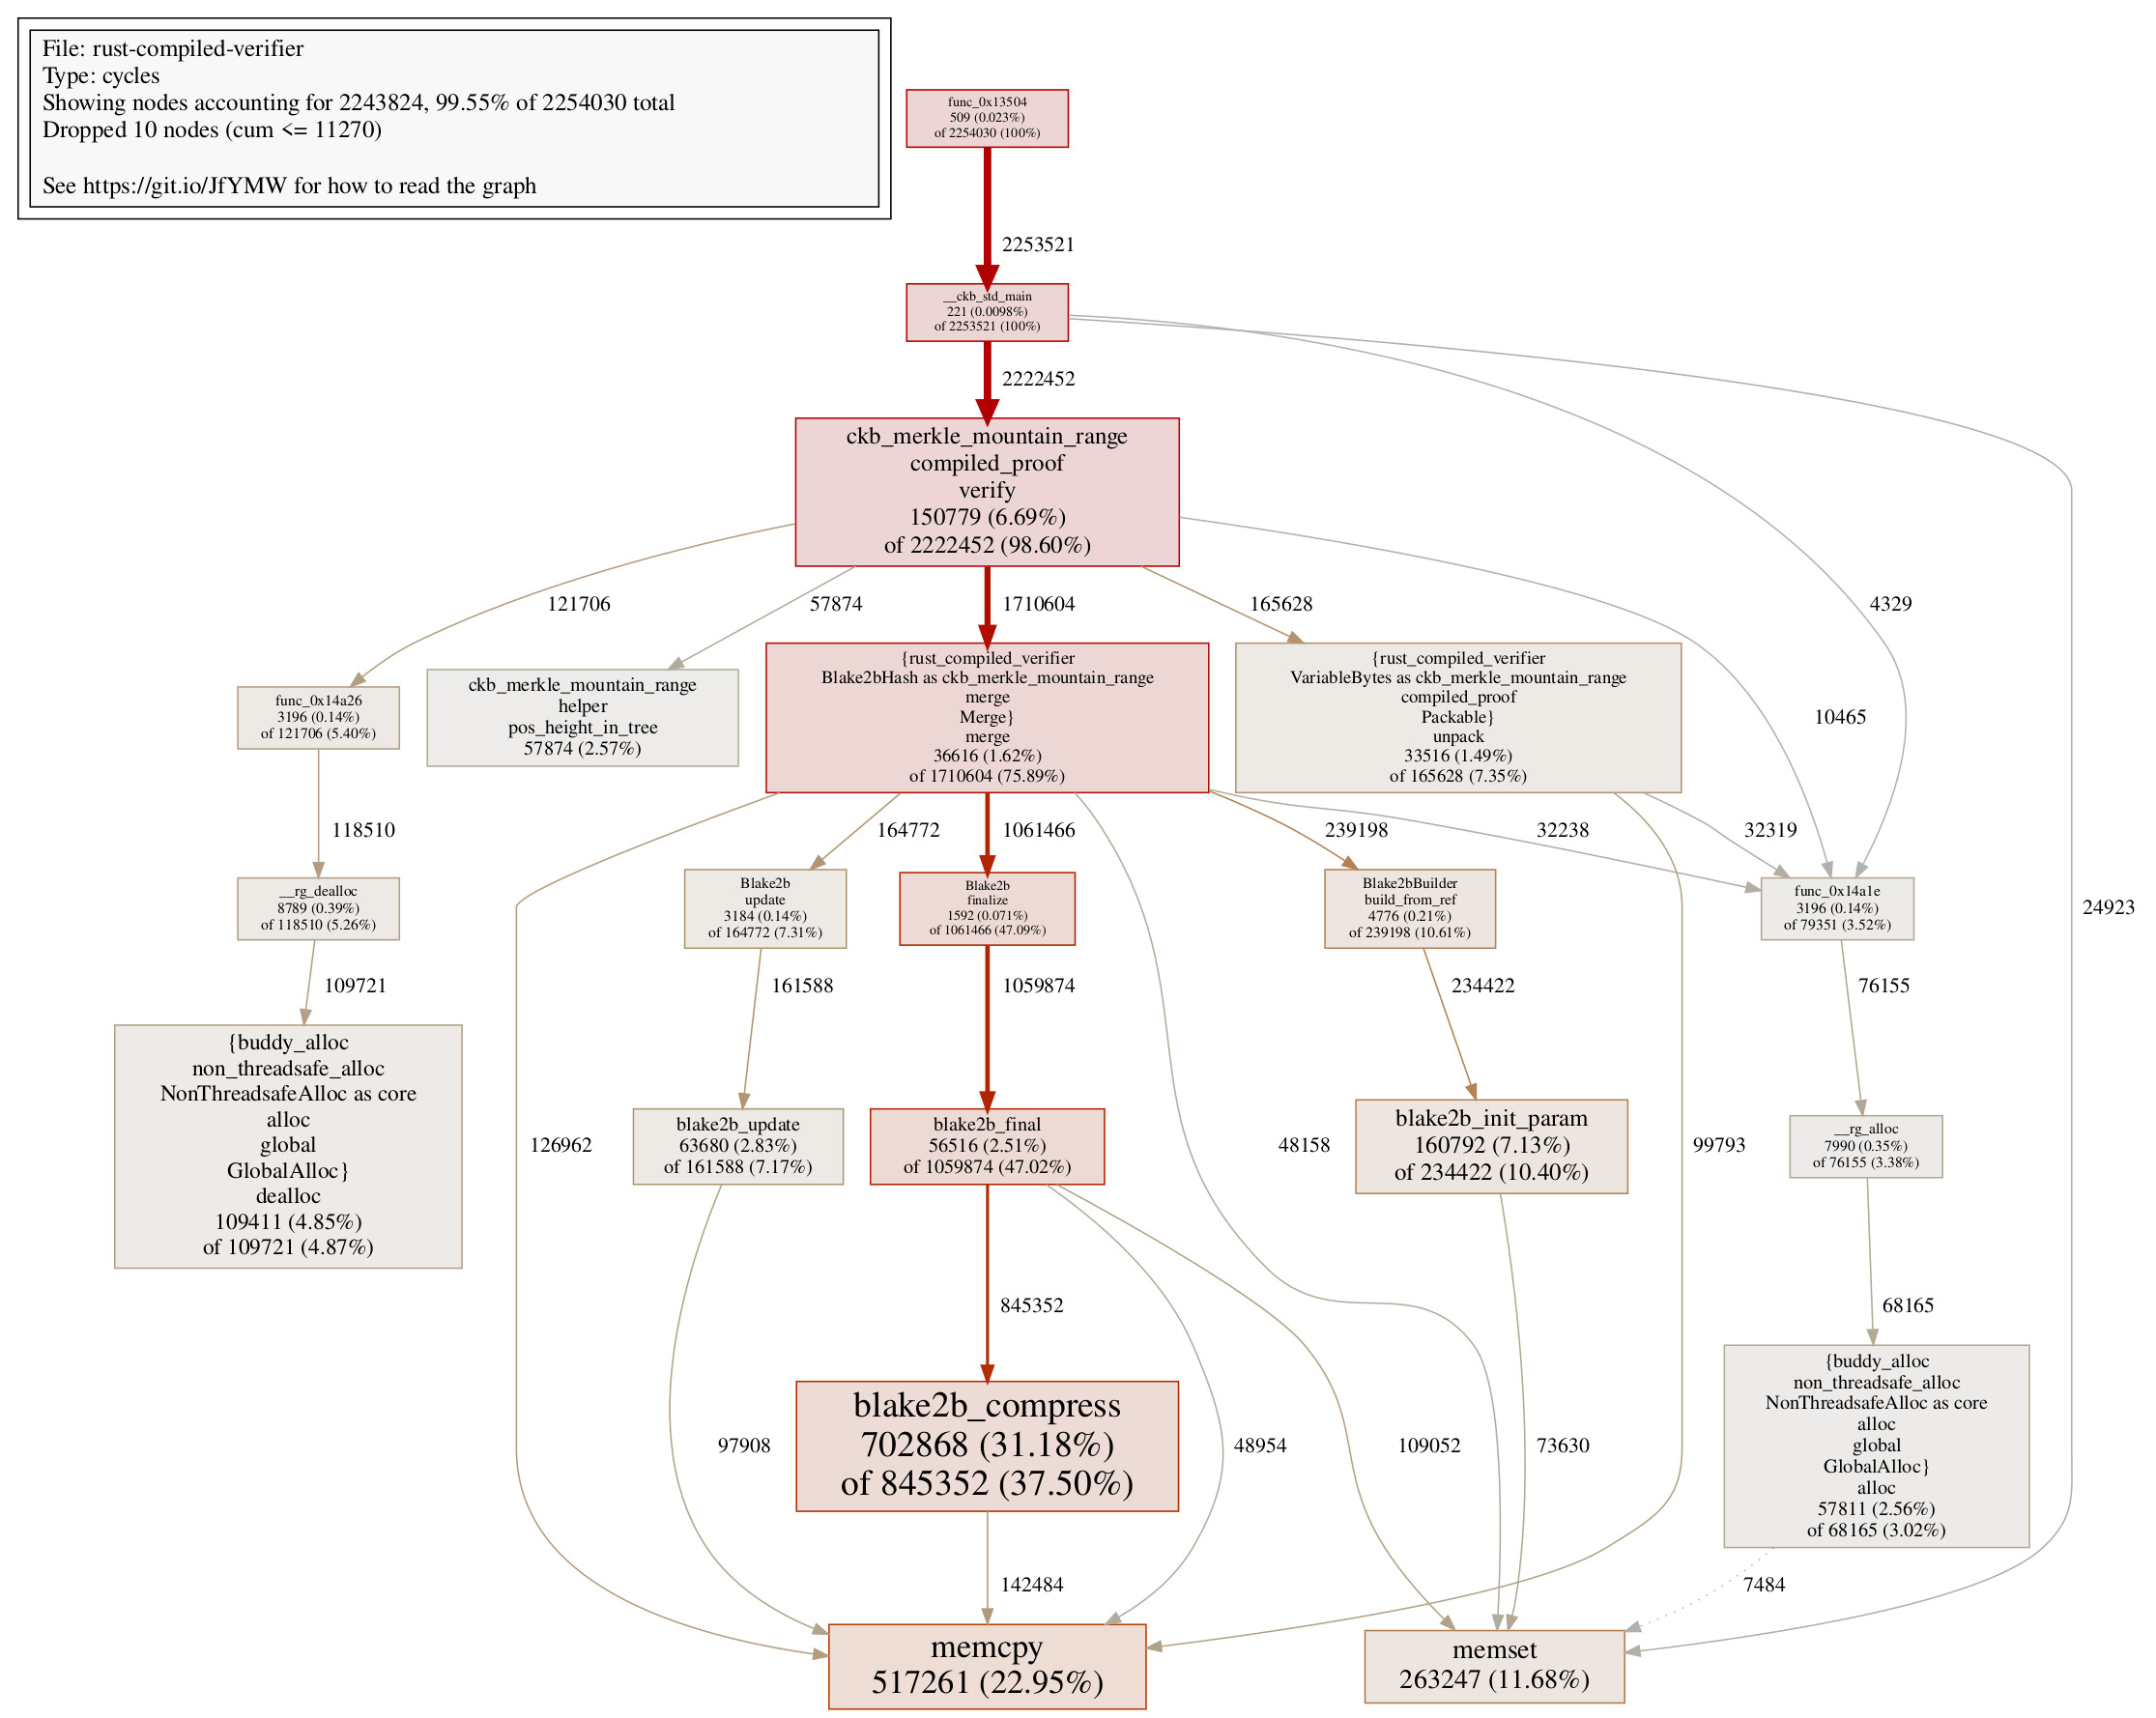
The call graph confirms the elimination of many blake2b initialization parts:
One thing worth mentioning here: from the call graph, we can find that the initialization function Blake2bBuilder::build_from_ref in the compiled Rust verifier takes 239198 cycles, which is even less than ckb_blake2b_init in the C verifier, which takes 292132 cycles. Sometimes having a different API design, allows us to achieve even more cycle reductions, this is an example of such a case here. There are somewhat 50000 cycle reductions that are enabled in the way Rust API is designed, which might not be an easy thing to do in the C code.
Worse Attempt 1: Handle 32 Bytes as a Special Case on the Stack
It’s worth mentioning that optimizations will not always work, sometimes the changes one makes will turn out to be worse while hoping for the best. Here’s such an example.
In the call graph for Step 4, one might notice roughly 150000 cycles are spent on do_reserve_and_handle of vectors. Those can be traced back to Vec resize functions in the code. To accommodate for either proof items read from proof, or make space for new hash values, we are creating many small vectors, adding pressures on the heap, causing all those do_reserve_and_handle calls.
One observation is that all the non-leaf nodes in an MMR, contain hash values of 32 bytes long, only leaves can be longer or shorter than 32 bytes. Since the majority of nodes, as well as proof items, are 32 bytes, what if we treat 32 bytes as a special case? Instead of:
struct VariableBytes(Vec<u8>);
What if we write:
enum VariableBytes {
    Hash([u8; 32]),
    Dynamic(Vec<u8>),
}
All the hash values can use the enum variant Hash, which happily lives on the stack without heap allocations. And for the rare case of leaf values, we can use the enum variant Dynamic, which provides a variable length buffer.
To checkout the code at this stage, and build it, use the following command:
$ cd $TOP/mmr-post-demo; git checkout worse-attempt-1; ./build.sh
You can see the code changed at this stage here. As hinted by the section name, the branch name and the commit message, this change is actually making the performance worse:
root@homerig:~/code/mmr-post-demo# SEED=1680833947559458126 ./target/release/tx-generator tx.json target/riscv64imac_zba_zbb_zbc_zbs-unknown-ckb-elf/release/rust-baseline-verifier c_verifier target/riscv64imac_zba_zbb_zbc_zbs-unknown-ckb-elf/release/rust-compiled-verifier
Seed: 1680833947559458126
Total leafs: 2520, tested leafs: 76
MMR size: 5034
Proof bytes: 10990, leaf bytes: 3192 leaves: 76
root@homerig:~/code/mmr-post-demo# ckb-debugger --tx-file tx.json --cell-type input --script-group-type lock --cell-index 2 --pprof compiled.data
Run result: 0
Total cycles consumed: 2555066(2.4M)
Transfer cycles: 9825(9.6K), running cycles: 2545241(2.4M)
Compared to the previous step’s 2382911 cycles, this change actually consumes noticeably more cycles! The call graph reveals that we are spending way, way more cycles on memcpy:

Digging into the assembly code a bit, we would notice something weird in the generated code. Look at this:
impl Merge for Blake2bHash {
    type Item = VariableBytes;

    fn merge(lhs: &Self::Item, rhs: &Self::Item) -> Result<Self::Item> {
                // code omitted

        let mut hash = [0u8; 32];
        hasher.finalize(&mut hash);
        Ok(VariableBytes::from_hash(hash))
    }
}
One would expect the compiler to know this: okay, ignoring the wrapped Result for a second, the return value will be a VariableBytes::from_hash, and I know that hash array will go directly into the enum data part. So I can simply erase hash array here, and let hasher.finalize write directly to the address within VariableBytes enum containing the same 32-byte array.
You would expect that a modern, sophisticated compiler knows how to do this value erasure, correct?
Well, the generated code tells a different story:
let mut hash = [0u8; 32];
   1359c:       ea02                    sd      zero,272(sp)
   1359e:       e602                    sd      zero,264(sp)
   135a0:       e202                    sd      zero,256(sp)
   135a2:       fd82                    sd      zero,248(sp)
        hasher.finalize(&mut hash);
   135a4:       0a28                    addi    a0,sp,280
   135a6:       858a                    mv      a1,sp
   135a8:       0f800613                li      a2,248
   135ac:       00002097                auipc   ra,0x2
   135b0:       286080e7                jalr    646(ra) # 15832 <memcpy>
   135b4:       0a28                    addi    a0,sp,280
   135b6:       19ac                    addi    a1,sp,248
   135b8:       02000613                li      a2,32
   135bc:       00004097                auipc   ra,0x4
   135c0:       834080e7                jalr    -1996(ra) # 16df0 <_ZN10blake2b_rs7blake2b7Blake2b8finalize17he89c5e66dddac40cE>
        Ok(VariableBytes::from_hash(hash))
   135c4:       00190513                addi    a0,s2,1
   135c8:       19ac                    addi    a1,sp,248
   135ca:       02000613                li      a2,32
   135ce:       00002097                auipc   ra,0x2
   135d2:       264080e7                jalr    612(ra) # 15832 <memcpy>
   135d6:       00090023                sb      zero,0(s2)
    }
   135da:       22813083                ld      ra,552(sp)
   135de:       22013403                ld      s0,544(sp)
   135e2:       21813483                ld      s1,536(sp)
   135e6:       21013903                ld      s2,528(sp)
   135ea:       23010113                addi    sp,sp,560
   135ee:       8082                    ret
The generated code here first allocates memory for hash on the stack, calls hasher.finalize on hash, then copies the value in hash back to the designated location in the returned enum. This is adding a lot of copying operations, resulting in more cycles being consumed.
For the curious minds: you might actually notice two memcpy calls in the above-generated code, let’s ignore the memcpy call at address 0x135b0, since this is a different issue that will be resolved in later steps.
There is some mitigation to the code we can use:
$ cd $TOP/mmr-post-demo; git checkout worse-attempt-1-mitigation; ./build.sh
You can see the mitigation here. Basically, instead of passing an array to the construction function of VariableBytes, we rather expose the internal buffer within VariableBytes, and invoke memory writing functions on the buffer. This helps the code a bit, but we are still looking at a performance regression:
root@homerig:~/code/mmr-post-demo# SEED=1680833947559458126 ./target/release/tx-generator tx.json target/riscv64imac_zba_zbb_zbc_zbs-unknown-ckb-elf/release/rust-baseline-verifier c_verifier target/riscv64imac_zba_zbb_zbc_zbs-unknown-ckb-elf/release/rust-compiled-verifier
Seed: 1680833947559458126
Total leafs: 2520, tested leafs: 76
MMR size: 5034
Proof bytes: 10990, leaf bytes: 3192 leaves: 76
root@homerig:~/code/mmr-post-demo# ckb-debugger --tx-file tx.json --cell-type input --script-group-type lock --cell-index 2 --pprof compiled.data
Run result: 0
Total cycles consumed: 2496300(2.4M)
Transfer cycles: 9845(9.6K), running cycles: 2486455(2.4M)
If I were to take a guess, the increased VariableBytes (40 bytes now than the previously 24 bytes) really put more pressure on the stack (as well as spilled registers), not to mention that the call graph still shows significantly more memcpy calls are performed. We are really looking at a case where we aim for the good part, but the darker side eventually makes the code worse in terms of performance.
Step 5 Use Boxed Fixed-Length Value
What if we were to strike a balance here? We would still want to handle 32-byte values differently, but we are keeping them on the heap, not the stack. This results in the change in Step 5. To checkout the code in Step 5 and build it, use the following command:
$ cd $TOP/mmr-post-demo; git checkout step-5; ./build.sh
You can see the code changed in Step 5 here. While the gap is smaller, we can still see gains from the change here:
root@homerig:~/code/mmr-post-demo# SEED=1680833947559458126 ./target/release/tx-generator tx.json target/riscv64imac_zba_zbb_zbc_zbs-unknown-ckb-elf/release/rust-baseline-verifier c_verifier target/riscv64imac_zba_zbb_zbc_zbs-unknown-ckb-elf/release/rust-compiled-verifier
Seed: 1680833947559458126
Total leafs: 2520, tested leafs: 76
MMR size: 5034
Proof bytes: 10990, leaf bytes: 3192 leaves: 76
root@homerig:~/code/mmr-post-demo# ckb-debugger --tx-file tx.json --cell-type input --script-group-type lock --cell-index 2 --pprof compiled.data
Run result: 0
Total cycles consumed: 2266974(2.2M)
Transfer cycles: 9190(9.0K), running cycles: 2257784(2.2M)
The call graph shows a tidier picture without calls on do_reserve_and_handle here.
This shows us that even though we are still using heaps, different allocation patterns can definitely have an impact on performance.
Step 6 Unnecessary Memcpy Operations
Remember that mysterious memcpy at 0x135b0? Let’s take a look at it again:
   135a4:       0a28                    addi    a0,sp,280
   135a6:       858a                    mv      a1,sp
   135a8:       0f800613                li      a2,248
   135ac:       00002097                auipc   ra,0x2
   135b0:       286080e7                jalr    646(ra) # 15832 <memcpy>
Following the RISC-V calling convention, we can deduce that this is a memcpy operation, that copies 248 bytes of data from the address stored in the register sp to the address sp + 280. Recall that we are dealing with 32-byte hash values in this merge function, so this definitely has nothing to do with returned VariableBytes value. A similar code can be found in the code generated in Step 5 as well, so this has nothing to do with our regression change as well.
What is it then? It turns out, this has to do with blake2b-rs crate, the finalize function is written like the following:
pub fn finalize(mut self, dst: &mut [u8]) {
    unsafe {
        blake2b_final(
            self.state.as_mut_ptr(),
            dst.as_mut_ptr() as *mut c_void,
            dst.len(),
        );
    }
}
And our merge function at this point, is written like this:
fn merge(lhs: &Self::Item, rhs: &Self::Item) -> Result<Self::Item> {
    let mut hasher = Blake2b::uninit();
    HASH_BUILDER.build_from_ref(&mut hasher);
    hasher.update(&lhs.as_bytes());
    hasher.update(&rhs.as_bytes());
    let mut hash: Box<[u8; 32]> = Box::default();
    hasher.finalize(&mut hash[..]);
    Ok(VariableBytes::Hash(hash))
}
Notice the finalize function actually consumes the hasher variable. In the current version of Rust compiler, the compiler would emit code to move the hasher variable to a new location on stack, before calling the finalize function. It might be due to certain safety guarantees, or it might just be due to a small quirk in the current compiler. Regardless, what we observed here is, redundant memcpy operations are inserted here. Hence in Step 6, we added a new finalize_from_ref function in blake2b-rs, which takes mutable references of the hasher instead of ownership.
To checkout the code at Step 6 and build it, use the following command:
$ cd $TOP/mmr-post-demo; git checkout step-6; ./build.sh
You can see the code changed in Step 6 here. This further strips down noticeable running cycles compared to the original code:
root@homerig:~/code/mmr-post-demo# SEED=1680833947559458126 ./target/release/tx-generator tx.json target/riscv64imac_zba_zbb_zbc_zbs-unknown-ckb-elf/release/rust-baseline-verifier c_verifier target/riscv64imac_zba_zbb_zbc_zbs-unknown-ckb-elf/release/rust-compiled-verifier
Seed: 1680833947559458126
Total leafs: 2520, tested leafs: 76
MMR size: 5034
Proof bytes: 10990, leaf bytes: 3192 leaves: 76
root@homerig:~/code/mmr-post-demo# ckb-debugger --tx-file tx.json --cell-type input --script-group-type lock --cell-index 2 --pprof compiled.data
Run result: 0
Total cycles consumed: 2137617(2.0M)
Transfer cycles: 9183(9.0K), running cycles: 2128434(2.0M)
The call graph confirms that almost all the cycle reductions come from a reduced number of calls to memcpy:
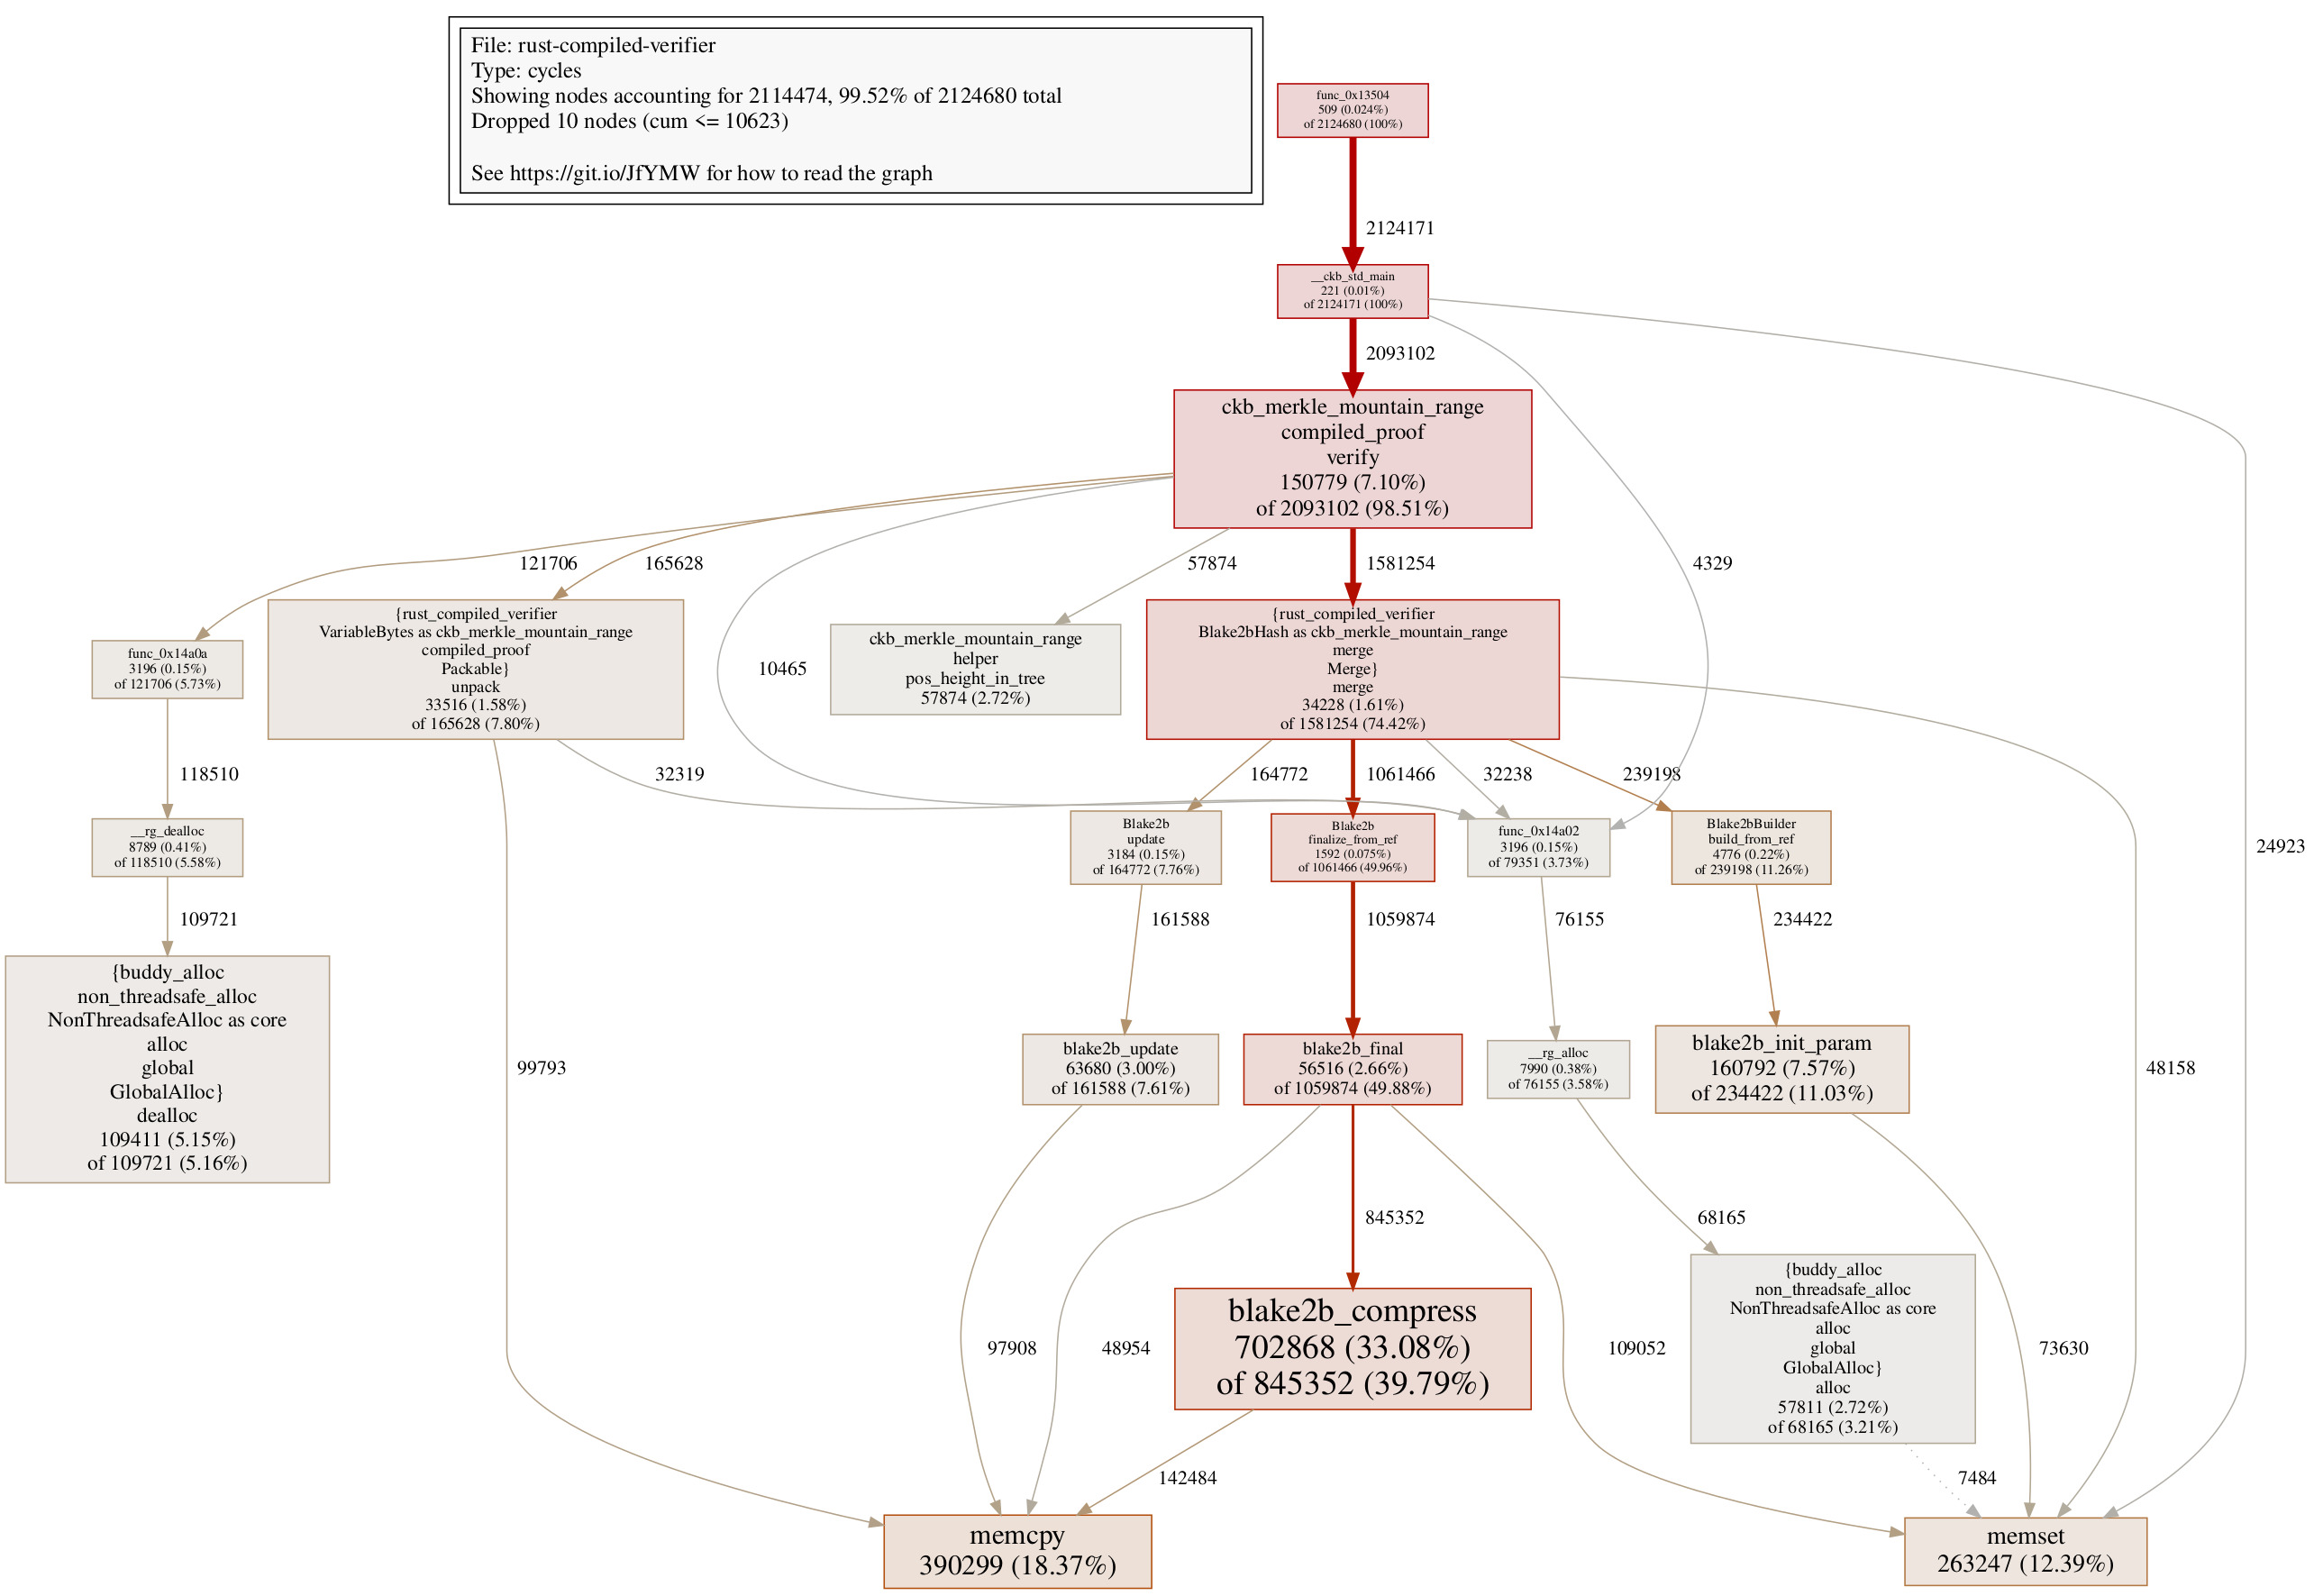
It’s worth mentioning we are entering a controversial territory here: while this change indeed improves performance, one can argue that it is not so idiomatic Rust anymore: the original code which takes ownership of hasher perfectly ensures that the hasher object shall not be used after calling finalize, but the new finalize_from_ref only takes a mutable reference, meaning the hasher object is still available after calling finalize_from_ref, making it dangerous that someone might abuse it. So is it worthwhile to apply the optimization? I don’t have an answer yet, different teams might have different opinions regarding this piece of change. It also might be the case that several iterations later, Rust compiler would automatically generate optimized code here. For the completeness of this post though, it’s worthwhile to point out this behavior now.
Step 7 Upgrade CKB-STD for Newer buddy-alloc
Step 7 is rather easy here, we simply upgrade ckb-std from 0.11.0 to latest 0.12.1, since 0.12.1 contains a newer version of buddy-alloc with optimizations that requires smaller but importantly, constant cycles in the initialization phase.
To checkout the code in Step 7 and build it, use the following command:
$ cd $TOP/mmr-post-demo; git checkout step-7; ./build.sh
You can see the code changed in Step 7 here. Here the performance gain is rather small (~15000 cycles):
root@homerig:~/code/mmr-post-demo# SEED=1680833947559458126 ./target/release/tx-generator tx.json target/riscv64imac_zba_zbb_zbc_zbs-unknown-ckb-elf/release/rust-baseline-verifier c_verifier target/riscv64imac_zba_zbb_zbc_zbs-unknown-ckb-elf/release/rust-compiled-verifier
Seed: 1680833947559458126
Total leafs: 2520, tested leafs: 76
MMR size: 5034
Proof bytes: 10990, leaf bytes: 3192 leaves: 76
root@homerig:~/code/mmr-post-demo# ckb-debugger --tx-file tx.json --cell-type input --script-group-type lock --cell-index 2 --pprof compiled.data
Run result: 0
Total cycles consumed: 2124227(2.0M)
Transfer cycles: 9228(9.0K), running cycles: 2114999(2.0M)
But we are merely upgrading the version number of a crate. Sometimes there will be lower-hanging fruits available, and it might not be a bad thing to remember them.
Step 8 Use Non-Zeroed Memory
A little warning first: this change officially introduces us to a dangerous territory, a certain number of engineers would tend to believe that we might not be writing idiomatic Rust at all.
The previous call graph shows that we are still consuming more cycles on memset compared to the C version, which is indeed the case due to those initialization lines:
let mut d: Box<[u8; 32]> = Box::default();

let mut proof_buffer = [0u8; 32 * 1024];
let mut proof_buffer = [0u8; 32 * 1024];
For safety reasons, Rust requires zero-initialized memory by default. While we do embrace this in most cases, we are now at a stage where zero-initialized memory caused us noticeable performance loss here. Assuming we know what we are doing here, can we work with non-zeroed memory? In Step 8 of our optimization work, we are tackling this problem.
To checkout the code in Step 8 and build it, use the following command:
$ cd $TOP/mmr-post-demo; git checkout step-8; ./build.sh
You can see the code changed in Step 8 here. There are 3 different cases we will need to change in our code:
For boxed values, we are using the still-experimental
[Box::new_uninit]API, which is still living behindnew_uninitfeature.For proof buffer, we are using static variables, note it would require a wrapper function, so as to deal with the
unsafepart, but apart from that, we can use it pretty much like a normal memory buffer, many thanks to the fact that CKB is a strictly single-threaded systemFor leaves buffer, we could leverage the same technique as a proof buffer, but we chose to do it using
MaybeUninit::uninit, while the 2 methods are roughly the same in terms of cycle reductions, we are showcasing 2 ways of doing this for you to decide which one suits your need better.
Albeit dangerous, this change does bring us noticeable cycle reductions at ~88000 cycles
root@homerig:~/code/mmr-post-demo# SEED=1680833947559458126 ./target/release/tx-generator tx.json target/riscv64imac_zba_zbb_zbc_zbs-unknown-ckb-elf/release/rust-baseline-verifier c_verifier target/riscv64imac_zba_zbb_zbc_zbs-unknown-ckb-elf/release/rust-compiled-verifier
Seed: 1680833947559458126
Total leafs: 2520, tested leafs: 76
MMR size: 5034
Proof bytes: 10990, leaf bytes: 3192 leaves: 76
root@homerig:~/code/mmr-post-demo# ckb-debugger --tx-file tx.json --cell-type input --script-group-type lock --cell-index 2 --pprof compiled.data
Run result: 0
Total cycles consumed: 2049057(2.0M)
Transfer cycles: 9165(9.0K), running cycles: 2039892(1.9M)
The call graph shows way less cycle consumption on memset here. In fact, the cycle consumption on memset in the Rust compiled verifier is quite close to the C verifier. We shall see later that the remaining difference here actually reveals an interesting secret.
It really depends on individual teams to debate if they want to employ this strategy or not. However, it’s worth mentioning that the static variable technique used for proof buffer surprisingly turns out to be quite useful in a different optimization we shall see in a bit.
Worse Attempt 2: Use Bytes for Sharing Buffers
Let’s do a little bit of math here:
The call graph at Step 8 shows that the Rust verifier consumes 390299 cycles on memcpy.
The earlier call graph shows that the C verifier consumes 375484 cycles on memcpy.
They might look close, but remember that after Step 4, the Rust verifier does not need to do multiple blake2b initializations anymore. If we remove 45372 cycles spent on memcpy in the C verifier due to blake2b initialization, that means the C verifier consumes 330112 cycles on memcpy which can be compared to the Rust verifier.
This difference now more or less matches the 99793 cycles in the Rust verifier, where
unpackneeds to call memcpy
So the question here is: can we eliminate the unpack call onto memcpy? By pointer magic, this is completely eliminated in the C version. If we can eliminate this call in the Rust version, the Rust code might have superior performance than the C version!
Looking at the code, what we really want, is that the smart contract can read the whole MMR proof in a single buffer, then either share the whole buffer, or slice of it anywhere in the code without needing to copy it, in other words, a reference counted buffer that supports slicing. Does this ring a bell in the Rust world? Yes, we have bytes crate, which is exactly built for this use case! Now the question has been transformed: can we use bytes to eliminate unnecessary memory copying?
To checkout the code using bytes and build it, use the following command:
$ cd $TOP/mmr-post-demo; git checkout worse-attempt-2; ./build.sh
You can see the actual code change here, notice it requires changes in the Merkle-mountain-range crate as well.
As you might already have been hinted, this is actually resulting in worse performance:
root@homerig:~/code/mmr-post-demo# SEED=1680833947559458126 ./target/release/tx-generator tx.json target/riscv64imac_zba_zbb_zbc_zbs-unknown-ckb-elf/release/rust-baseline-verifier c_verifier target/riscv64imac_zba_zbb_zbc_zbs-unknown-ckb-elf/release/rust-compiled-verifier
Seed: 1680833947559458126
Total leafs: 2520, tested leafs: 76
MMR size: 5034
Proof bytes: 10990, leaf bytes: 3192 leaves: 76
root@homerig:~/code/mmr-post-demo# ckb-debugger --tx-file tx.json --cell-type input --script-group-type lock --cell-index 2 --pprof compiled.data
Run result: 0
Total cycles consumed: 2258237(2.2M)
Transfer cycles: 10249(10.0K), running cycles: 2247988(2.1M)
The call graph more or less reveals that bytes crate, while great for x86_64 native programs, turns out to contain too much overhead for a resource-constrained environment such as CKB.

Short Recap
Our journey optimizing the Rust compiled verifier is coming to an end. We’ve come a long way from the beginning:
$ cd $TOP/mmr-post-demo; git checkout step-8; ./build.sh

root@homerig:~/code/mmr-post-demo# SEED=1680833947559458126 ./target/release/tx-generator tx.json target/riscv64imac_zba_zbb_zbc_zbs-unknown-ckb-elf/release/rust-baseline-verifier c_verifier target/riscv64imac_zba_zbb_zbc_zbs-unknown-ckb-elf/release/rust-compiled-verifier
Seed: 1680833947559458126
Total leafs: 2520, tested leafs: 76
MMR size: 5034
Proof bytes: 10990, leaf bytes: 3192 leaves: 76
root@homerig:~/code/mmr-post-demo# ckb-debugger --tx-file tx.json --cell-type input --script-group-type lock --cell-index 0 --pprof baseline.data
Run result: 0
Total cycles consumed: 2827123(2.7M)
Transfer cycles: 10748(10.5K), running cycles: 2816375(2.7M)
root@homerig:~/code/mmr-post-demo# ckb-debugger --tx-file tx.json --cell-type input --script-group-type lock --cell-index 1 --pprof c.data
Run result: 0
Total cycles consumed: 1710518(1.6M)
Transfer cycles: 2501(2.4K), running cycles: 1708017(1.6M)
root@homerig:~/code/mmr-post-demo# ckb-debugger --tx-file tx.json --cell-type input --script-group-type lock --cell-index 2 --pprof compiled.data
Run result: 0
Total cycles consumed: 2049057(2.0M)
Transfer cycles: 9165(9.0K), running cycles: 2039892(1.9M)
All optimizations considered, we managed to reduce 778066 cycles from the baseline verifier, or roughly 27.5% of the running cycles. This is still some gap from our goal of 40% cycle reduction, but personally, I think we are still somewhat within readable, idiomatic Rust, striking a balance between performance, and code readability.
It’s definitely worth asking: the best Rust version now is still 338539 cycles from the C version, what is remained on the table?
An easy find is
func_0x1490aandfunc_0x14912, which respectively correspond to__rust_allocand__rust_dealloc, those 2 functions contribute to 187621 cycles, more than half of the differences between the Rust and C versions. I would personally consider this a cost of having heap allocations. Without them, one would have to manually design a memory layout, much like we did in the C verifier.Depending on your way of calculation, either 60187 or 99793 more cycles are spent on
memcpyin the Rust version, due tounpackfunction calling memcpy. This is more or less an API huddle, and it is unclear if we can have an idiomatic Rust API that eliminates those copying costsRoughly 23084 more cycles are spent on
memsetin the Rust verifier. This is actually due to a very interesting story we will show next.
Apart from those parts, the Rust compiled verifier uses roughly the same level of cycles compared to the best C verifier.
Unveiling the Memset Story via BPF
To tell the story of memset, we need to introduce a special toolkit named eBPF, or BPF for short. Originally designed for customizing packet filtering purposes, BPF has started to see wide adoption as a way to instrument the runtime performance of Linux processes in a production setting. For more introduction on BPF in general, please consult Brendan Gregg’s amazing talk.
We have started leveraging BPF as a way to instrument CKB smart contracts. While we will be only using a small fraction of BPF’s functionality, we already benefit from BPF’s great flexibility. Here let’s use BPF to inspect the differences between the Rust compiled verifier, and the C verifier.
NOTE: you have to be in a native environment to run BPF functions, a docker container environment might not work!
If you have followed previous commands in Environment Setup, you already have the required tools installed. To verify this, run the following command:
$ $TOP/ckb-vm-bpf-toolkit/tools/functrace.py
A binary must be provided for inspection!
Let’s compile the binaries, then generate the transaction JSON file in Step 8 first:
$ cd $TOP/mmr-post-demo; git checkout step-8; ./build.sh

root@homerig:~/code/mmr-post-demo# SEED=1680833947559458126 ./target/release/tx-generator tx.json target/riscv64imac_zba_zbb_zbc_zbs-unknown-ckb-elf/release/rust-baseline-verifier c_verifier target/riscv64imac_zba_zbb_zbc_zbs-unknown-ckb-elf/release/rust-compiled-verifier
Seed: 1680833947559458126
Total leafs: 2520, tested leafs: 76
MMR size: 5034
Proof bytes: 10990, leaf bytes: 3192 leaves: 76
Now we can first inspect memset usage in the Rust compiled verifier:
$ cd $TOP/mmr-post-demo
$ sudo $TOP/ckb-vm-bpf-toolkit/tools/functrace.py \\
        --tx-file tx.json --cell-type input --script-group-type lock --cell-index 2 \\
        --bin target/riscv64imac_zba_zbb_zbc_zbs-unknown-ckb-elf/release/rust-compiled-verifier \\
        --bpf-func memset --bpf-regs a2
Profiling func memset
Enter to start executing:
Run result: Ok(0)
Total cycles consumed: 2049057(2.0M)
Transfer cycles: 9165(9.0K), running cycles: 2039892(1.9M)

Func memset has been called 1194 times!
Stats for a2:
     a2                  : count     distribution
         0 -> 1          : 0        |                                        |
         2 -> 3          : 0        |                                        |
         4 -> 7          : 0        |                                        |
         8 -> 15         : 0        |                                        |
        16 -> 31         : 0        |                                        |
        32 -> 63         : 0        |                                        |
        64 -> 127        : 796      |****************************************|
       128 -> 255        : 398      |********************                    |
We are using a tool named functrace in ckb-vm-bpf-toolkit. This tool allows one to instrument all the places where a function is called, and gather statistics on any RISC-V registers. Here we are gathering info for a2, which contains the length of the buffer passed to memset. Here we can see that in the Rust verifier, memset has been called 1194 times, roughly 2/3 of all the calls are on a buffer whose length is between the range of [64, 127].
We can instrument memset on the C verifier similarly:
$ cd $TOP/mmr-post-demo
$ sudo $TOP/ckb-vm-bpf-toolkit/tools/functrace.py \\
        --tx-file tx.json --cell-type input --script-group-type lock --cell-index 1 \\
        --bin c_verifier
        --bpf-func memset --bpf-regs a2
There is more than one entry matching memset, please include more chars to narrow down the search:
memset.part.0
memset
$ sudo $TOP/ckb-vm-bpf-toolkit/tools/functrace.py \\
        --tx-file tx.json --cell-type input --script-group-type lock --cell-index 1 \\
        --bin c_verifier
        --bpf-func memset$ --bpf-regs a2
Profiling func memset
Enter to start executing:
Run result: Ok(0)
Total cycles consumed: 1710518(1.6M)
Transfer cycles: 2501(2.4K), running cycles: 1708017(1.6M)

Func memset has been called 398 times!
Stats for a2:
     a2                  : count     distribution
         0 -> 1          : 0        |                                        |
         2 -> 3          : 0        |                                        |
         4 -> 7          : 0        |                                        |
         8 -> 15         : 0        |                                        |
        16 -> 31         : 0        |                                        |
        32 -> 63         : 0        |                                        |
        64 -> 127        : 398      |****************************************|
$ sudo $TOP/ckb-vm-bpf-toolkit/tools/functrace.py \\
        --tx-file tx.json --cell-type input --script-group-type lock --cell-index 1 \\
        --bin c_verifier
        --bpf-func memset.part.0 --bpf-regs a2
Profiling func memset.part.0
Enter to start executing:
Run result: Ok(0)
Total cycles consumed: 1710518(1.6M)
Transfer cycles: 2501(2.4K), running cycles: 1708017(1.6M)

Func memset.part.0 has been called 1194 times!
Stats for a2:
     a2                  : count     distribution
         0 -> 1          : 0        |                                        |
         2 -> 3          : 0        |                                        |
         4 -> 7          : 0        |                                        |
         8 -> 15         : 0        |                                        |
        16 -> 31         : 0        |                                        |
        32 -> 63         : 0        |                                        |
        64 -> 127        : 796      |****************************************|
       128 -> 255        : 398      |********************                    |
Different from the Rust compiled verifier, the C verifier actually has 2 functions memset and memset.part.0, while memset.part.0 has been called 1194 times, the same as the Rust one, memset has only been called 398 times, which is far less a number. Both the Rust compiled verifier and the C verifier share the exact same implementation of memset underneath, why is this happening?
Upon some research, it does seem the trick lies in a GCC optimization named [function splitting pass]. While the C code might be slightly convoluted, the comment is quite readable: what it basically does, is that larger functions can be split into multiple ones, so some of the split parts can be inlined for better performance. While the Rust compiler has to leverage GCC to compile memset first, then link it against the Rust code it generates, the C compiler sees the C verifier code and the memset code as a whole, allowing it to apply more optimizations, such as function splitting pass. This is the reason why the C verifier can spend ~23000 fewer cycles than the Rust compiled verifier, even when they share the same memset implementation, using the same optimization level 3 when compiling the code.
Step 9 Applying Steps 4 - 8 to Baseline Verifier
With the compiled verifier optimized, we can come back to look at the baseline verifier, can we apply the same optimization accumulated throughout the journey on the baseline verifier? It turns out the answer is yes, for the most part. In Step 9, we will apply optimizations from Steps 4 - 8 on the baseline verifier, seeing how the performance is gonna be.
To checkout the code at Step 9 and build it, use the following command:
$ cd $TOP/mmr-post-demo; git checkout step-9; ./build.sh
You can see the code changed in Step 9 here. The number here is quite encouraging:
root@homerig:~/code/mmr-post-demo# SEED=1680833947559458126 ./target/release/tx-generator tx.json target/riscv64imac_zba_zbb_zbc_zbs-unknown-ckb-elf/release/rust-baseline-verifier c_verifier target/riscv64imac_zba_zbb_zbc_zbs-unknown-ckb-elf/release/rust-compiled-verifier
Seed: 1680833947559458126
Total leafs: 2520, tested leafs: 76
MMR size: 5034
Proof bytes: 10990, leaf bytes: 3192 leaves: 76
root@homerig:~/code/mmr-post-demo# ckb-debugger --tx-file tx.json --cell-type input --script-group-type lock --cell-index 0 --pprof baseline.data
Run result: 0
Total cycles consumed: 2332683(2.2M)
Transfer cycles: 10408(10.2K), running cycles: 2322275(2.2M)
root@homerig:~/code/mmr-post-demo# ckb-debugger --tx-file tx.json --cell-type input --script-group-type lock --cell-index 1 --pprof c.data
Run result: 0
Total cycles consumed: 1710518(1.6M)
Transfer cycles: 2501(2.4K), running cycles: 1708017(1.6M)
root@homerig:~/code/mmr-post-demo# ckb-debugger --tx-file tx.json --cell-type input --script-group-type lock --cell-index 2 --pprof compiled.data
Run result: 0
Total cycles consumed: 2049057(2.0M)
Transfer cycles: 9165(9.0K), running cycles: 2039892(1.9M)
The Rust baseline verifier decreases from 2827123 cycles to 2332683 cycles, resulting in a 17.5% reduction of the overall running time. The compiled verifier is still faster due to the interpreter-based verification design, but it’s interesting to see that without changing algorithms, we can still find ways to speed up the baseline verifier.
Step 10 Sharing Memory in Baseline Verifier
Let’s ask one more question: is there any optimization that can be applied on the baseline verifier, but not on the compiled verifier? Turns out there is one! Remember that memcpy in unpack consumes almost 100000 cycles in the compiled verifier? We wanted to share slices of memory buffer instead of copying, but got stuck due to Packable trait API design. Here in the baseline verifier, with a little help from static variables, we can do memory sharing instead of copying by changing VariableBytes to the following:
enum VariableBytes {
    Hash(Box<[u8; 32]>),
    Dynamic(&'static [u8]),
}
One might ask questions: but you are using static lifetime! Remember the proof buffer trick earlier?
static mut _ROOT_BUFFER: [u8; 32] = [0u8; 32];
fn root_buffer() -> &'static mut [u8] {
    unsafe { &mut _ROOT_BUFFER }
}

static mut _PROOF_BUFFER: [u8; 32 * 1024] = [0u8; 32 * 1024];
fn proof_buffer() -> &'static mut [u8] {
    unsafe { &mut _PROOF_BUFFER }
}

static mut _LEAVES_BUFFER: [u8; 32 * 1024] = [0u8; 32 * 1024];
fn leaves_buffer() -> &'static mut [u8] {
    unsafe { &mut _LEAVES_BUFFER }
}
By having root, proof and leaves all in static variables, we can create slices of static lifetime from them freely! This brings our final step optimizing the Rust baseline verifier.
To checkout the code at Step 10 and build it, use the following command:
$ cd $TOP/mmr-post-demo; git checkout step-10; ./build.sh
You can see the code changed in Step 10 here. And the results are included here:
root@homerig:~/code/mmr-post-demo# SEED=1680833947559458126 ./target/release/tx-generator tx.json target/riscv64imac_zba_zbb_zbc_zbs-unknown-ckb-elf/release/rust-baseline-verifier c_verifier target/riscv64imac_zba_zbb_zbc_zbs-unknown-ckb-elf/release/rust-compiled-verifier
Seed: 1680833947559458126
Total leafs: 2520, tested leafs: 76
MMR size: 5034
Proof bytes: 10990, leaf bytes: 3192 leaves: 76
root@homerig:~/code/mmr-post-demo# ckb-debugger --tx-file tx.json --cell-type input --script-group-type lock --cell-index 0 --pprof baseline.data
Run result: 0
Total cycles consumed: 1836013(1.8M)
Transfer cycles: 9854(9.6K), running cycles: 1826159(1.7M)
root@homerig:~/code/mmr-post-demo# ckb-debugger --tx-file tx.json --cell-type input --script-group-type lock --cell-index 1 --pprof c.data
Run result: 0
Total cycles consumed: 1710518(1.6M)
Transfer cycles: 2501(2.4K), running cycles: 1708017(1.6M)
root@homerig:~/code/mmr-post-demo# ckb-debugger --tx-file tx.json --cell-type input --script-group-type lock --cell-index 2 --pprof compiled.data
Run result: 0
Total cycles consumed: 2049057(2.0M)
Transfer cycles: 9165(9.0K), running cycles: 2039892(1.9M)
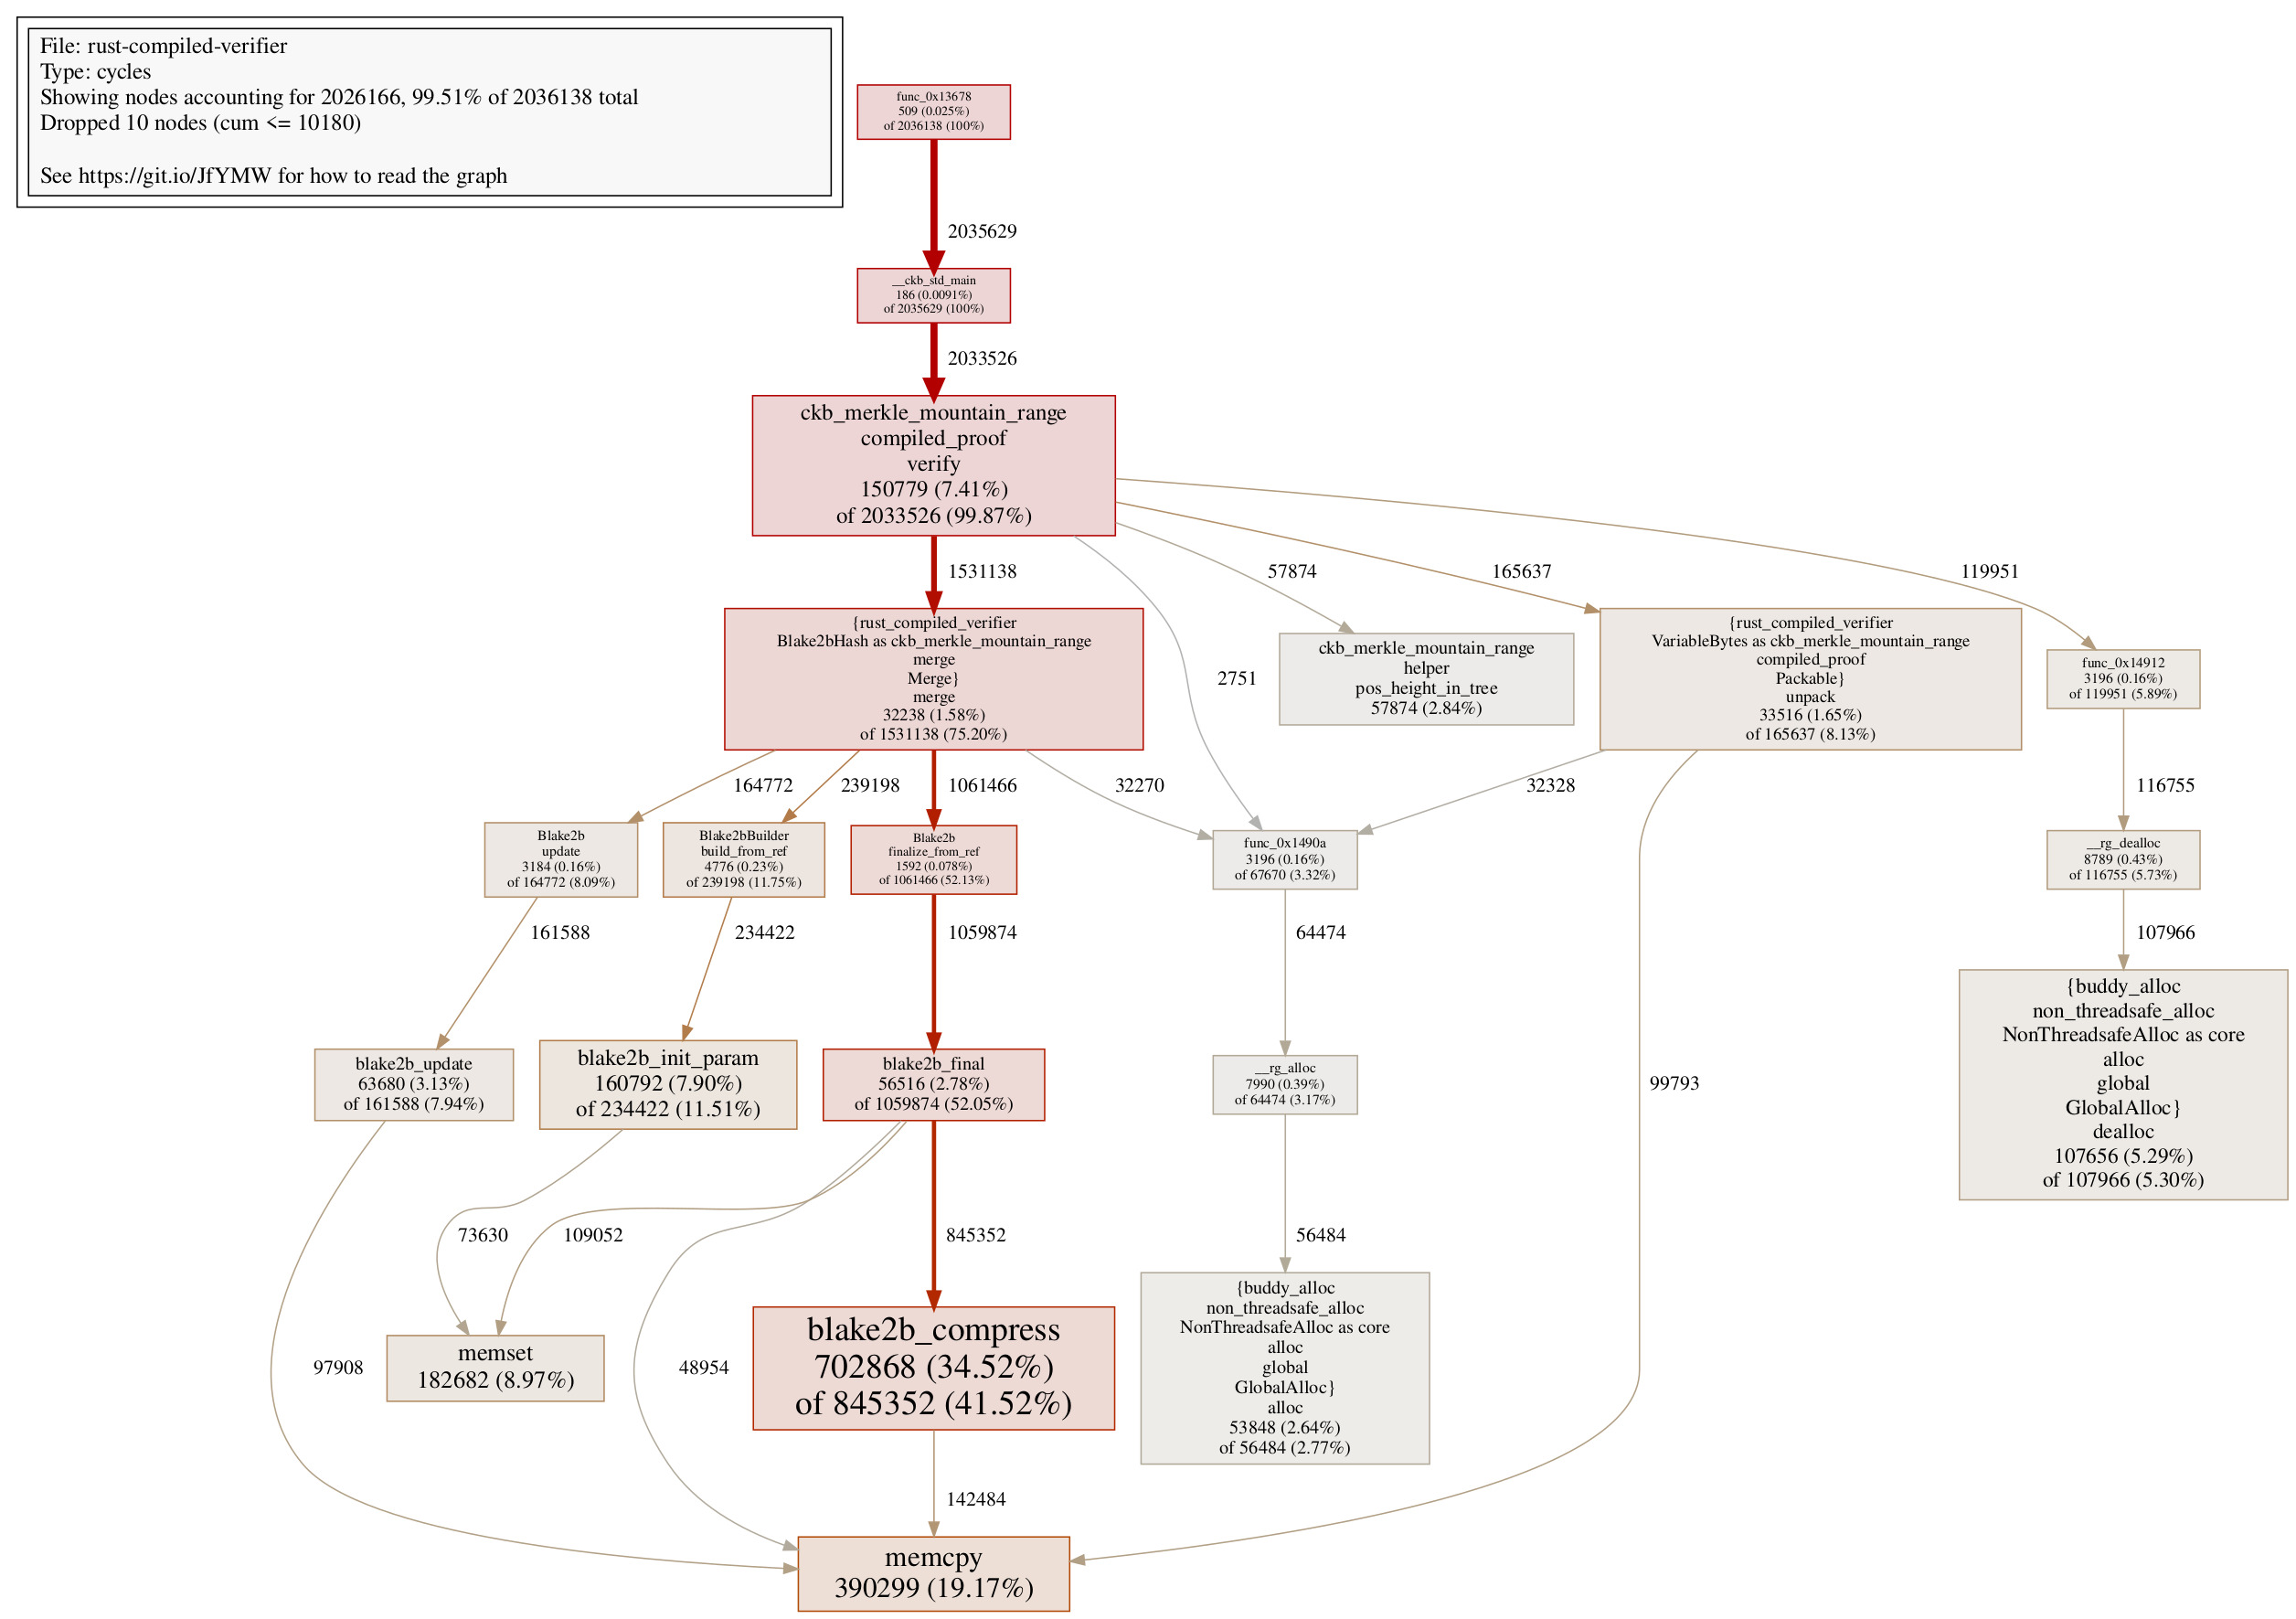
What's fascinating here, is that with the memory sharing technique, the Rust baseline verifier provides even better performance than the Rust compiled verifier, despite the fact that the latter one uses a slightly better verification algorithm. The call graph of the Rust baseline verifier at this step is also quite tidy:

At this stage, the fastest Rust verifier (being the Rust baseline verifier) consumes only 119895 more cycles than the C verifier. It’s also worth mentioning that in the fastest Rust verifier, __rust_alloc, __rust_dealloc, __rust_realloc combined, consume 117641 cycles. This means that excluding the memory allocation, the fastest Rust verifier is very close to the C verifier, while being somewhat readable Rust code.
Are Some Optimizations Really Necessary?
Even though we have come a long way optimizing smart contracts, it’s always better to take optimizations with a grain of salt. Compilers are also improving at an amazing speed, the optimizations we introduce today might be obsolete a year from now, and some optimizations we apply today might even make the code slower in the future. For example, the optimization done in Steps 5 and 6 is most likely obsolete given the time compiler advances. Other optimizations might be due to language semantics, such as in Step 8, which are less likely to be fixed automatically by a compiler. So it’s always a good idea to balance between code clarity and performance. When in doubt, we should always make code beautiful first, only when the performance becomes a problem, will we then consider all the optimizations. Quoting our pioneer Joe Armstrong here:
Make it work, then make it beautiful, then if you really, really have to, make it fast. 90 percent of the time, if you make it beautiful, it will already be fast. So really, just make it beautiful!
Conclusion
If you have followed me here, I’m sure you will have mixed feelings regarding this optimization journey, we have good work, we have quirks, we have run into obstacles, and we also have surprising results. Personally, I have learned the following tips:
Always measure the performance, never guess. We are terrible at guessing
Performance is a tradeoff: optimizing one part of the code might affect other parts, and the overall performance is not always better
Better algorithms do not always bet plain ones, careful implementation matters as much as pure algorithms
Nevertheless, I do hope this post can bring you some inspiration on building your beautiful (and performant) smart contracts.
✍🏻 by Xuejie Xiao
Make sure to check out Xuejie's personal blog Less is More for more tech-savvy content!
You may also be interested in: